“What are the benefits of using Process Capability Index?”
“How do I culculate?”
“What are the guidelines for interpreting the numbers?”
This article is for anyone with these questions or concerns.
Process capability refers to the ability of a process to produce products within specified limits.
A highly capable process means a stable process with minimal variation or bias.
In this article, we explain the benefits of quantifying process capability as an index, the methods for calculation, and guidelines for interpreting the numbers.
We also cover the differences and appropriate use of two representative indices, Cp and Cpk, hoping it will serve as a useful reference for you.
What Is the Process Capability Index?
Definition of the Process Capability Index
The process capability index quantifies the ability of a process to produce products within specified limits. Two representative indices are Cp and Cpk.
Simply put, it measures the probability of manufacturing products that meet specifications.
In manufacturing, some level of “variation” is inevitable.
When the population is finite, the probability of conforming products can be calculated by counting the number of good and defective items.
However, what if we consider a scenario where production is ongoing, and the population is effectively infinite?
In such cases, the number of good and defective items may vary daily, and inspecting every product is neither practical nor efficient.
This is where the concept of standard deviation (σ) comes into play.
Understanding Normal Distribution
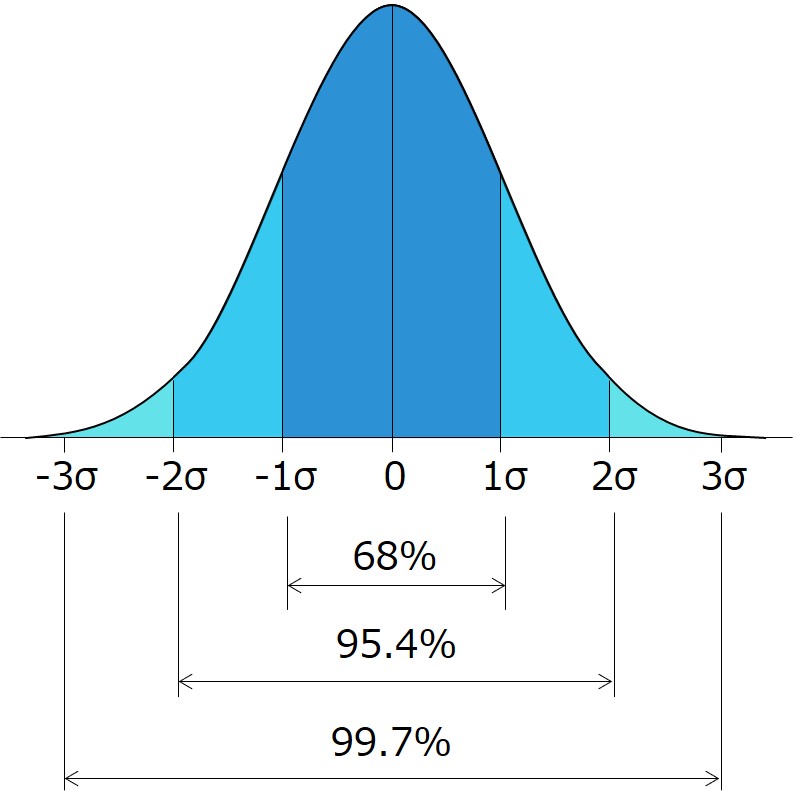
The following diagram represents a normal distribution (Gaussian distribution):
- The probability of occurrence is highest at the mean (center) and decreases toward both ends.
- In normal distribution, the standard deviation (σ) represents the range around the mean, within which a certain percentage of data falls.
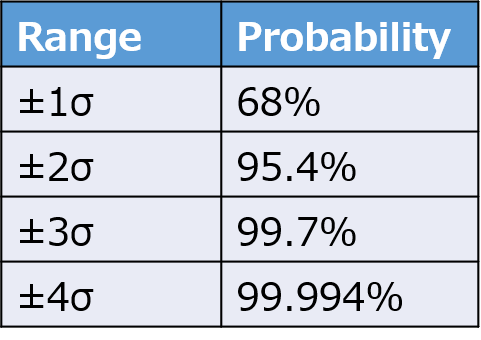
The table below illustrates how many multiples of σ correspond to what percentage, as determined by statistical principles.
This approach is used in process capability index to estimate the probability of products conforming to specifications.
Purpose and Applications
1. Visualizing Process Stability
Describing a process as “stable” can be subjective, with interpretations varying from person to person.
By calculating process capability index using defined methods, stability can be expressed as an objective numerical indicator.
2. Benchmark for Process Management
Process capability index fall within an appropriate range.
- Low value indicate process instability and the need for improvement.
- Excessively high value could signal overmanagement, which might lead to unnecessary resource usage or inefficiencies.
Numerical indices provide a basis for reviewing process management strategies.
3. Assessing the Quality of Procured Parts
Process capability index can also be interpreted as indicators of product quality, not just applied to in-house processes.
For example, calculating the index based on inspection reports for procured parts can help verify whether the components have sufficiently stable quality.
If the index indicate insufficient capability, it may be necessary to collaborate with suppliers to review and improve their processes.
Steps to Calculate the Process Capability Index
Calculation Method
Cp and Cpk are calculated using the following formulas:
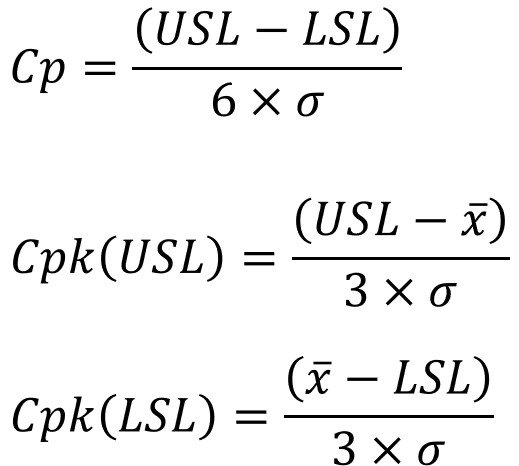
USL: Upper Specification Limit
LSL: Lower Specification Limit
$\bar{x}$:Average
σ: Standard deviation
Both indices require knowledge of the upper and lower specification limits (USL and LSL) as well as the standard deviation of the dataset, making the calculation straightforward.
For Cpk, two formulas are used—one for USL and one for LSL. The smaller of the two values (indicating the side with less margin relative to the specification) is used as the process capability index.
Difference Between Cp and Cpk, and the Meaning of Their Formulas
Both Cp and Cpk are based on a range of ±3σ (99.7%). Let’s explore the meaning of each formula:
Cp
The difference between the upper and lower specification limits represents the tolerance range.
Dividing this tolerance range by 6σ essentially calculates, “How many times does 6σ (±3σ) fit within the tolerance range?“
- For example, if Cp = 1.00: Tolerance Range = ±3σ×1.00.
This means 99.7% of the products fall within the tolerance range, leaving a defect rate of about 3 out of 1,000 products. - If Cp = 1.33: Tolerance Range = ±3σ×1.33 (99.994%).
This corresponds to a defect rate of 6 out of 100,000 products.
By calculating how many ±3σ intervals fit within the tolerance range, Cp expresses the stability of the process as the likelihood of avoiding defects.
Cpk
While Cp considers the tolerance range symmetrically around the mean, Cpk focuses on one side of the specification limits (upper or lower).
When the mean of the dataset ($\bar{x}$) aligns with the center of the specification range, Cp and Cpk will have the same value.
However, in most cases, the mean does not perfectly align with the center.
If one side of the specification has less margin, ignoring this asymmetry (as Cp does) would overestimate the process capability.
Therefore, Cpk is designed to evaluate the margin for the side closer to the specification limit, making it a more practical and commonly used metric in manufacturing.
By understanding that Cpk evaluates one-sided tolerance, it becomes easier to interpret the formula.
Cpk measures how many multiples of 3σ fit within the range from the mean to the nearest specification limit (either USL−$\bar{x}$ or $\bar{x}$−LSL).
This ensures a more realistic assessment of the process’s capability to produce conforming products.
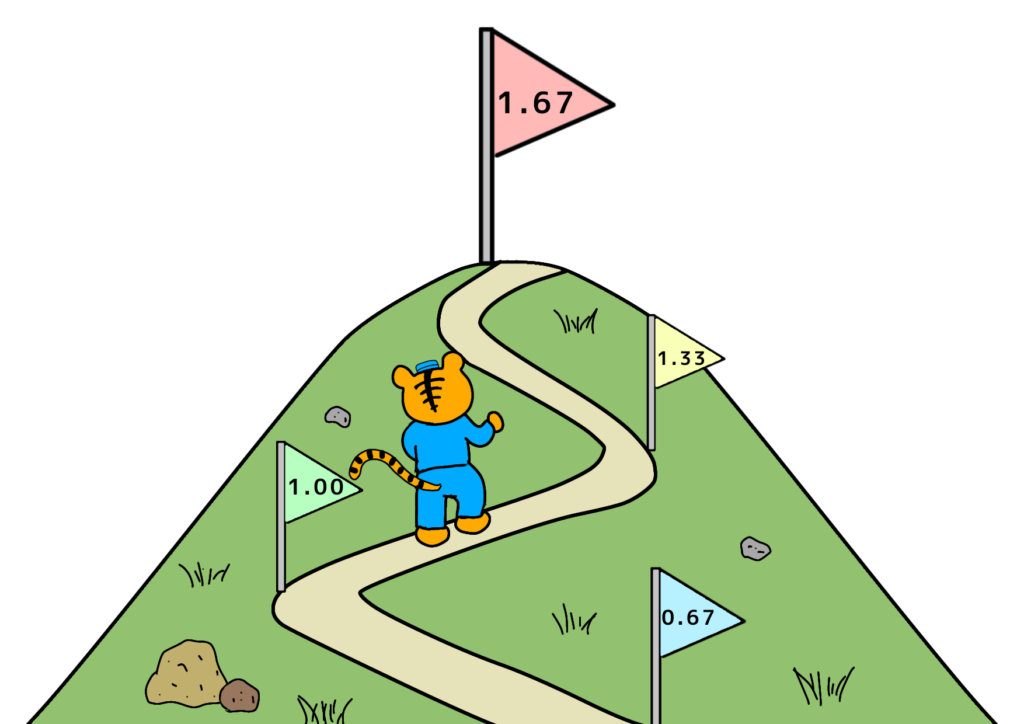
Numerical Benchmarks for Cp and Cpk
Recommended Ranges for Cp and Cpk
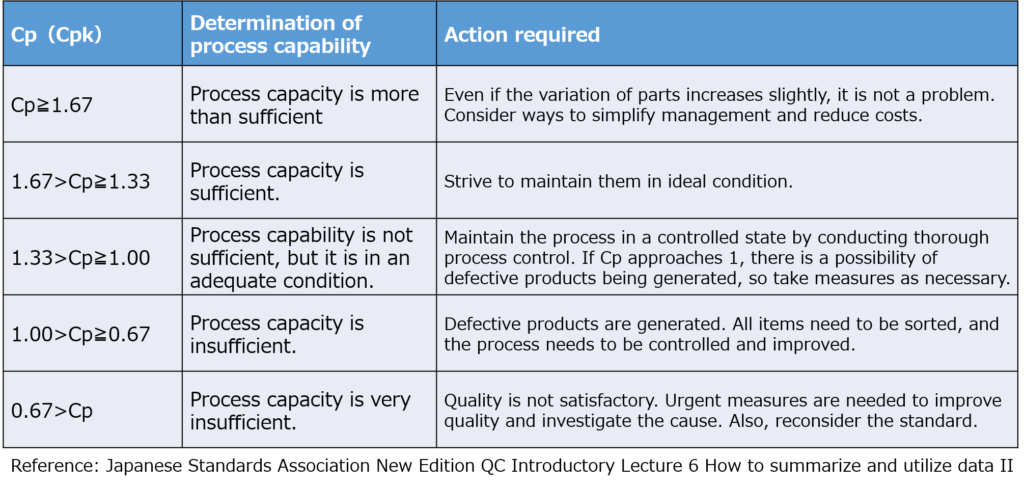
- Below 1.00: Improvement Required
If Cp or Cpk falls below 1.00, the process needs improvement.
This level indicates a defect rate of more than 3 per 1,000 units, which cannot be considered stable.
While the probability of defects may seem acceptable, variations in materials or processes could easily lead to defect rates exceeding 1% over time.
- Above 1.67: Possible Over-Control
Though better than low values, excessively high indices (e.g., Cpk approaching 2.00) may indicate over-controlling of the process.
This could result from strict material specifications or excessive inspection, leading to unnecessary material waste or increased inspection time.
Balancing Quality, Cost, and Delivery (QCD) is crucial. While maintaining high quality is essential, over-quality can inflate costs unnecessarily.
Precautions When Using Cp and Cpk
1. Review the basis for σ calculation
The ease of calculation for Cp and Cpk comes with the need for careful handling.
Since the standard deviation (σ) determines the entire calculation, the dataset’s conditions must be verified.
- Check for lot-to-lot variations or insufficient sample size, which may result in underestimating variability.
- Ensure that the sampling method appropriately represents the process to avoid skewed estimates.
2. Understand that Cp and Cpk are not absolute indicators
While numerical benchmarks provide a helpful guideline, they are not absolute standards.
- For instance, a process capability below 1.33 may still be acceptable in certain cases, such as one-off production with full inspection.
- Conversely, for products where safety is critical (e.g., automotive components), even a capability of 1.67 (6 defects per million) may not justify skipping inspections.
Set appropriate goals tailored to the product type and process conditions to ensure practical application.
3. Monitor trends continuously
Even after achieving a target capability, ongoing monitoring is essential.
- Production conditions change daily, and unnoticed shifts could lead to increased variability.
- Use control charts to track trends and prepare to address abnormalities promptly.
By maintaining a system for consistent monitoring and addressing changes in real-time, the process can remain stable and reliable over the long term.
Column
The Problem of Rushing to Conclusions
While the ability to quantify process stability with indices like Cp and Cpk is undoubtedly beneficial, there is an inherent risk of over-reliance on the numbers alone.
In my own experience managing a product line, calculating the process capability indices was straightforward.
However, the subsequent in-depth analysis of the process fell short, which caused challenges later on.
Many decision-makers tend to judge the quality of a process solely by the value of its indices. If the number is high, they may conclude that no further improvement is needed.
Unfortunately, this kind of shortsightedness can overlook underlying issues requiring attention.
I, too, struggled to communicate the necessity of additional analysis and process improvements. Without being able to articulate these needs effectively, I found myself swept along with the consensus that higher numbers equate to no further action.

Manage Alongside Supporting Evidence and Assumptions
Over time, the production process revealed variations due to differences in material lots, eventually exceeding acceptable limits.
This was a textbook example of an early concern becoming a reality later on.
Numerical indicators, while useful for clarity and objectivity, can propagate beyond their intended scope.
This creates the risk of misinterpretation or uninformed decision-making.
To mitigate this, always document and share the rationale and assumptions behind your judgments. For example:
- Data Sources: Where and how was the data collected?
- Sampling Conditions: What were the constraints during sampling?
These steps help preserve the context, making the information more robust and reliable for future evaluations.
Summary
What is the Process Capability Index?
A numerical representation of a process’s ability to produce products within specification limits.
Purpose and Applications:
- Visualize Process Stability: Transform subjective opinions into objective data.
- Provide a Baseline for Process Management: Identify areas for improvement or detect over-control.
- Evaluate Procurement Parts: Gauge supplier consistency using indices.
Cp and Cpk:
- Cp: Measures the tolerance range relative to ±3σ on both sides of the specification.
- Cpk: Focuses on the side closest to the specification, accounting for process bias.
Precautions for Handling Cp and Cpk:
- Review the basis for calculating σ: Confirm assumptions and data reliability.
- Understand that indices are not absolute standards: Tailor interpretations to your specific process and product.
- Track long-term trends: Continuously monitor and address deviations over time.
While there are risks of misusing these indices, the benefits of providing objective and easily calculable metrics are significant.
If you’re new to these concepts, try calculating the indices for a product you manage.
It could reveal valuable insights about your process’s true capabilities.




コメント