“What are the benefits of using QC Process Chart?”
“I want to know its structure and format.”
“I’d like to learn the steps to prepare one.”
This article is for anyone with such questions or concerns.
QC Process Chart is a table that organizes the entire flow from material acceptance to product shipment.
It outlines management items, methods, and procedures to address abnormalities in a single, comprehensive view.
Nowadays, it’s an essential tool for anyone involved in manufacturing. It frequently appears in interactions with suppliers and customers, preparing it indispensable.
In this article, we provide a detailed explanation of the purpose of preparing QC Process Chart, concrete examples of its format, and the steps to create one, all in a way that even beginners can understand.
We’ve compiled the fundamental knowledge that anyone in manufacturing should know at a minimum. We hope this serves as a helpful reference for you!
What is a QC Process Chart?
It represents a chart used for quality management.
QC Process Chart provides a comprehensive view of the entire flow from material acceptance to product shipment, listing management items, methods, and procedures to address abnormalities in a structured table.
A manufacturing flowchart, also referred to as a process flow diagram, visually represents the sequence of processes, including material acceptance, processing, inspection, storage, and shipment.
By associating management items with these processes, a QC Process Chart enables a clear overview of who, what, when, and how to manage each process.
It would not be an exaggeration to say that the QC Process Chart provides a complete understanding of process management.
Structure of a QC Process Chart
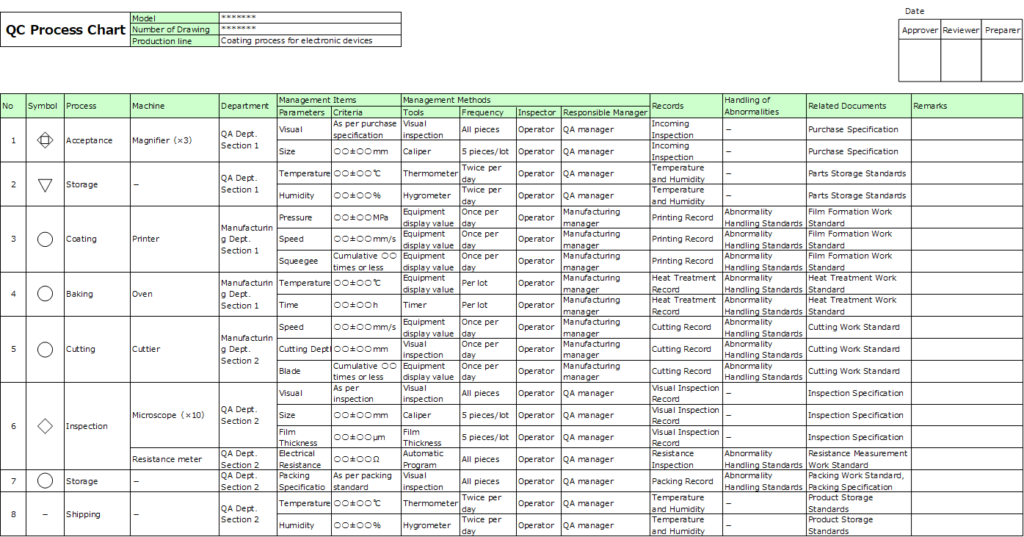
Below is an example of its format:
Main Components:
1. Process (Process Symbol Code, Process Name)
Process symbols are defined by official standards.
Further details will be explained in the section on preparation steps.
2. Management Items (Management Characteristics, Management Standards)
- Management characteristics: These refer to elements that determine product quality, such as the appearance of parts, equipment condition, or equipment parameters.
- Management standards: These are control values, specifying ranges for parameters like dimensions or temperatures.
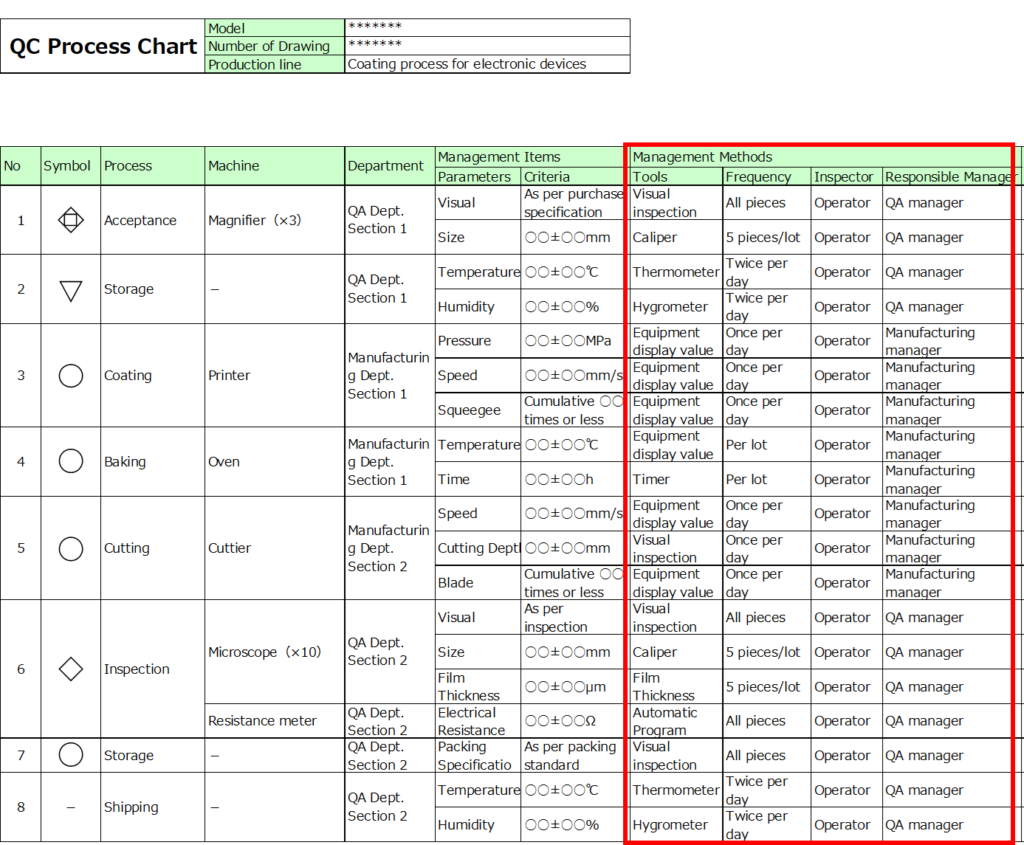
3. Management Methods
Define specific implementation methods, including:
- When, who, and how to manage.
- Measurement methods, frequency, responsible individuals, and accountability roles.
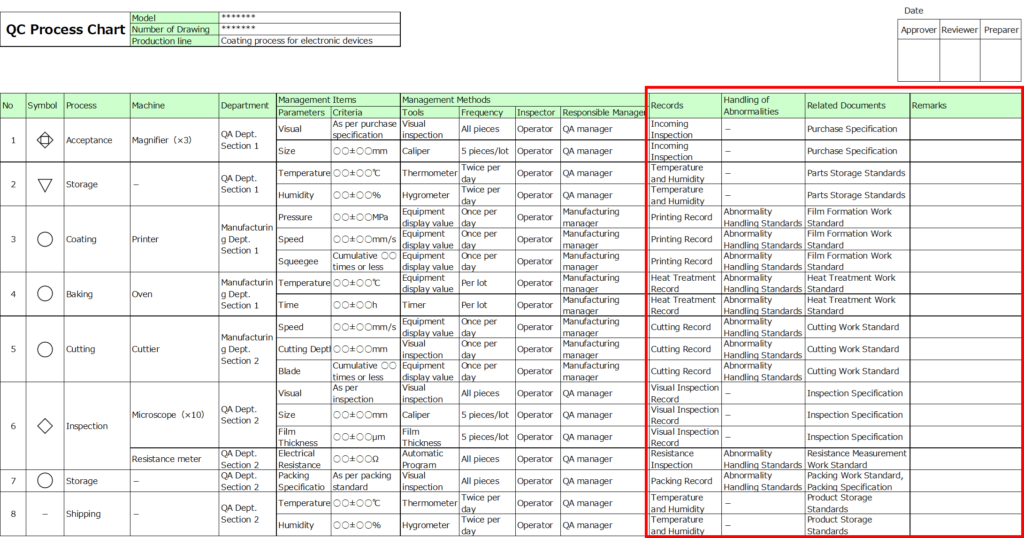
4. Records
Specify the format for recording data.
Examples include operational records for processing or inspection at each step.
5. Procedures for Handling Abnormalities
Document the rules, guidelines, or manuals to follow when addressing abnormalities. Include references to relevant procedures or regulations.
Purpose and Applications
1. Process Management
QC process chart centralizes parameters that affect quality, making it a valuable tool for process management.
For instance, it helps identify critical parameters during troubleshooting or when improving productivity, allowing for efficient action.
Additionally, it is often used by site supervisors and designers to manage changes in processes.
2. Explanatory Material
Since the process flow and management items can be understood at a glance, the chart is also used as explanatory material for third parties.
It may be requested during supplier quality audits or, conversely, required by customers for submission.
Moreover, it is frequently used as an educational resource for training new employees.
3. Preparation for Creating Standard Operating Procedures (SOPs)
The QC process chart serves as a foundation for creating SOPs.
It provides an overview of the entire process, functioning like a table of contents for SOPs, making it an excellent starting point to grasp the big picture.
While SOPs detail specific steps and precautions, they tend to focus on minute details.
Starting directly with SOP creation can make it challenging to maintain a bird’s-eye view, so beginning with a QC process chart is highly recommended.
Steps for Preparing a QC Process Chart
Let’s walk through the process of creating a QC process chart.
For this example, we’ll use a component involving the deposition of wiring electrodes onto a ceramic substrate.
1. Record Process Names
Begin by listing the process code and process name.
- Process codes should follow the classification system specified in JIS Z 8206 (Japanese official standards).
- For combined inspections, such as quality and quantity checks, use composite symbols as defined by JIS.
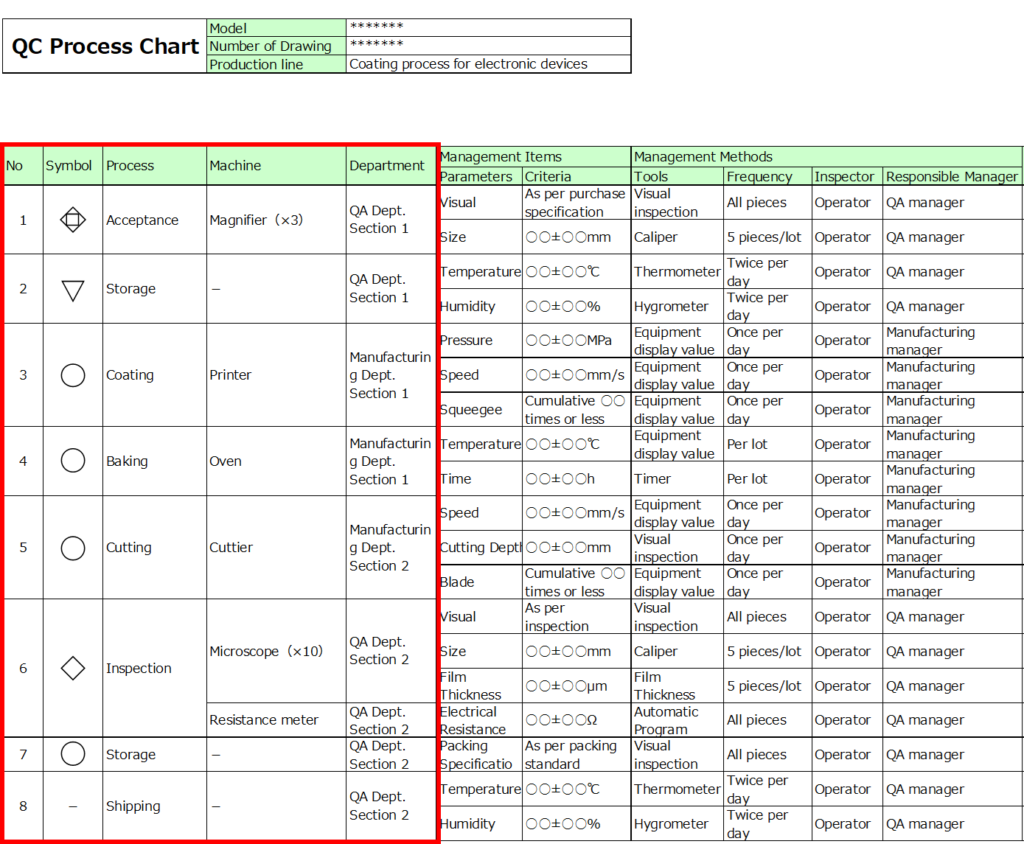
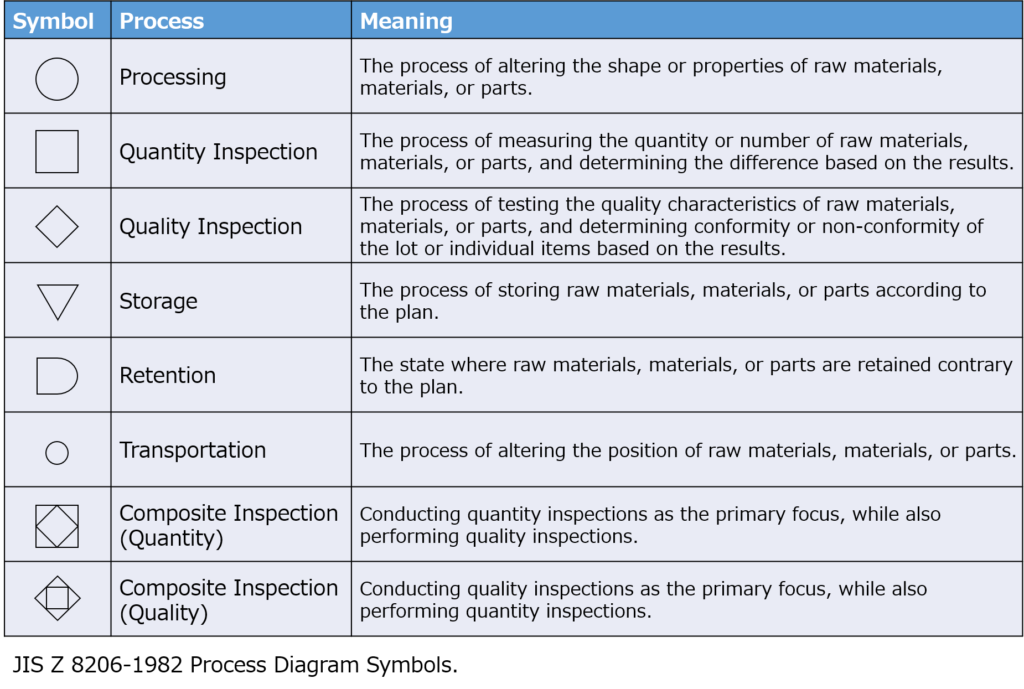
Additionally, include equipment names and the managing department for each process.
For inspection equipment like magnifiers or microscopes, specify details such as magnification levels to provide a clear understanding of inspection accuracy.
2. List Management Items
For management characteristics, include elements such as inspection standards for appearance or dimensions, manufacturing parameters, and tools or jigs.
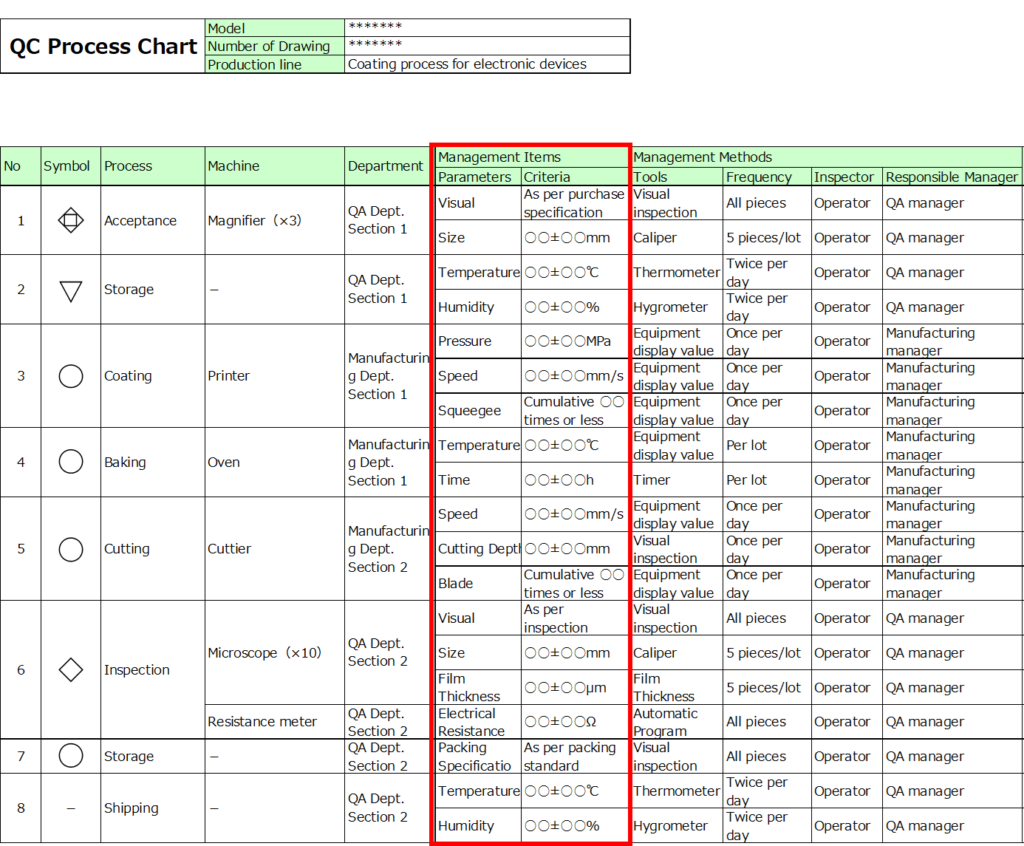
For management criteria, specify the acceptable ranges for each parameter.
In addition to central values, include upper and lower limits wherever applicable.For instance, while timer settings aim for precision, achieving exact results without any deviation is nearly impossible.
By defining acceptable ranges in advance, you can prevent unnecessary concerns about quality when slight deviations occur.
3. Define Management Methods
Next, detail the measurement methods and frequencies.
- Frequencies should be specified with concrete values, such as “once per day” or “100% inspection.”
- The appropriate frequency depends on process capability.
For example:
- Processes with a capability index (Cpk) of 1.33 or higher may rely on sampling inspections.
- For processes with a Cpk below 1.00, more frequent checks or additional inspections in subsequent stages may be necessary.
Clearly documenting the inspection frequency ensures that it aligns with objective criteria.
(Note: More information on process capability is available in related articles.)

4. Document Records, Procedures for Abnormalities, and Related Documents
Include the following:
- The record format for each process.
- Manuals or guidelines for addressing abnormalities.
- Any related documents or references.
This ensures a comprehensive overview of which standards to follow, what items to manage, and how quality records should be maintained, covering the entire workflow.
Key Points for Preparing a QC Process Chart
1. Don’t Aim for Perfection from the Start
In processes where management items and methods are well-established, creating a QC process chart can be straightforward. However, such cases are rare.
In fact, the opposite approach is often better—create a QC process chart during the development phase of a new product while designing the process flow.
Start with a basic template. Seeing an incomplete chart often motivates people to fill in the blanks.
Highlighting unclear management items or vague parameters is essential to identify and address uncertainties.
Even if it’s rough at first, using the QC process chart to clarify issues is highly recommended.
2. Clearly Define the Basis for Management Ranges
When setting ranges, document the rationale behind those settings.
Since the QC process chart serves as a vital tool for understanding overall quality management, its contents hold significant weight.
Even if the rationale becomes unclear over time, the chart should preserve the reasoning.
Link related technical documentation by including reference numbers or titles to provide traceable evidence for the set ranges.
3. Differentiate Between Internal and External Use
A common oversight is submitting a QC process chart originally designed for internal use directly to customers during audits or similar situations.
While detailed information is helpful internally, it can pose risks when shared externally.
For instance, critical management parameters and their acceptable ranges often contain valuable know-how that customers might find highly desirable.
To mitigate risks, prepare separate charts for internal and external use. Protect proprietary information while tailoring the chart for its intended audience.
However, overly redacting the chart can render it meaningless. For example, instead of providing exact management ranges, consider expressing them as multiples relative to a central value. This balances information sharing with confidentiality.
Column
Enormous amount of documents
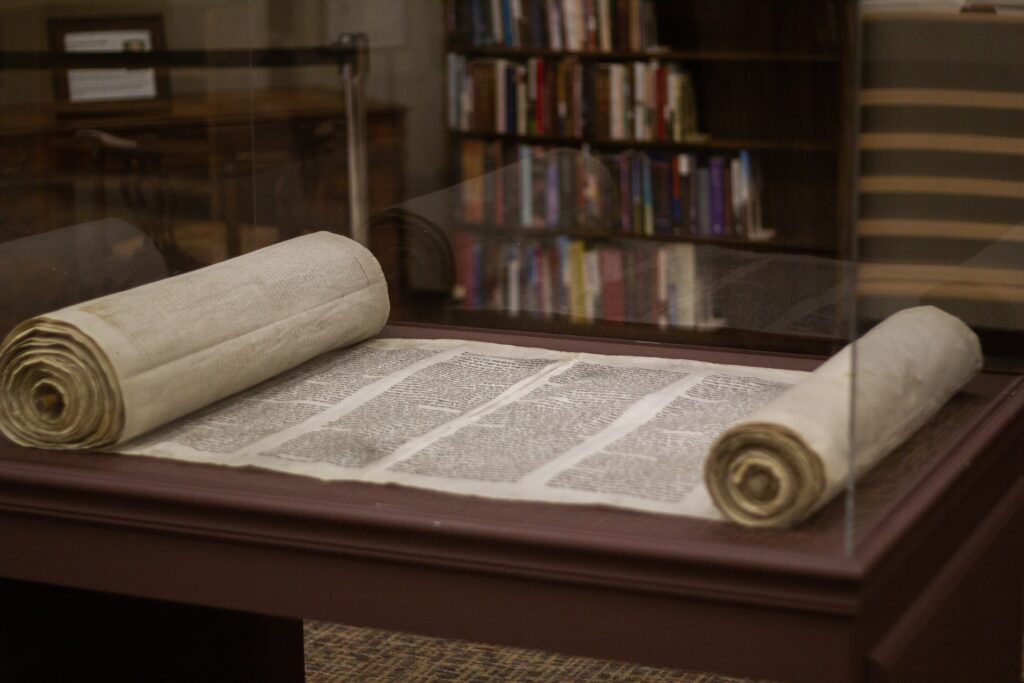
In the past, I encountered a QC process chart resembling a lengthy scroll while working on a product.
This product involved a large number of components and complex assembly steps, with a seemingly endless flow of similar tasks.
When we compiled all these processes into a single QC process chart, the result was a massive scroll-like document.
While it was beneficial to have all the information consolidated, it posed significant usability challenges:
- Losing track of which process was being reviewed.
- Confusing one process with another due to their similarities.
Ultimately, the scroll served its purpose during creation but was relegated to storage afterward, becoming an unused artifact.
Remember the Purpose
Although creating the chart helped organize thoughts initially, failing to use it as a living resource reduced its value to nothing more than wasted effort.
In this case, better strategies could have been employed:
- Splitting the chart into sections based on process sequences.
- Breaking it down into smaller charts organized by component units.
If process management is the goal, creating a user-friendly environment is critical for everyone involved in manufacturing.
Revisiting the Core Purpose
When issues like this arise, it’s essential to revisit the original purpose of the chart.
If challenges in usability or accessibility are identified, engage with related departments to address these problems collaboratively.
Establishing a practical, easy-to-manage system not only aligns with the chart’s objectives but also benefits the entire team involved in production.
Summary
QC Process Chart
- Definition: A table summarizing the flow from material reception to product shipment, listing management items and methods.
Purpose and Applications
- Process Management
- Reference Material for Explanations
- Preparation for Standard Document Creation
Steps for Creation
- Record Process Names
- List Management Items
- Define Management Methods
- Document Records, Procedures for Abnormalities, and Related Documents
Key Points for Creation
- Don’t Aim for Perfection from the Start
- Clearly Define the Basis for Management Ranges
- Differentiate Between Internal and External Use
The QC process chart is an essential piece of foundational knowledge for everyone involved in manufacturing.
It’s more than just a table of process flows—it’s a structured format that incorporates all the necessary elements for “Quality Management.”
If you’ve only ever seen one in passing, now is a great time to familiarize yourself with its format and applications.
It’s a valuable tool for ensuring product quality and process efficiency.




コメント