“What is QA Network used for?”
“What’s the difference between QA Network and Process FMEA?”
“I want to know how to prepare QA Network and the criteria for scoring.”
This article is for those who have such questions or concerns.
QA Network is an analytical method that uses a matrix of quality assurance items and process steps to identify and quantify where in the process defects are prevented from occurring or escaping.
Originally developed by the TOYOTA MOTOR CORPORATION, this method is now widely used by many companies as an effective tool for visualizing quality assurance levels.
In this article, we will explain the purpose and benefits of using QA Network, the steps to prepare one, and the criteria for scoring, with specific examples, so even beginners can understand.
We will also discuss the differences between the QA Network and Process FMEA, a similar method for analyzing failure modes.
We hope this serves as a helpful reference!
What is QA Network?
Structure of QA Network sheet
Let’s take a look at the details of the QA network format.
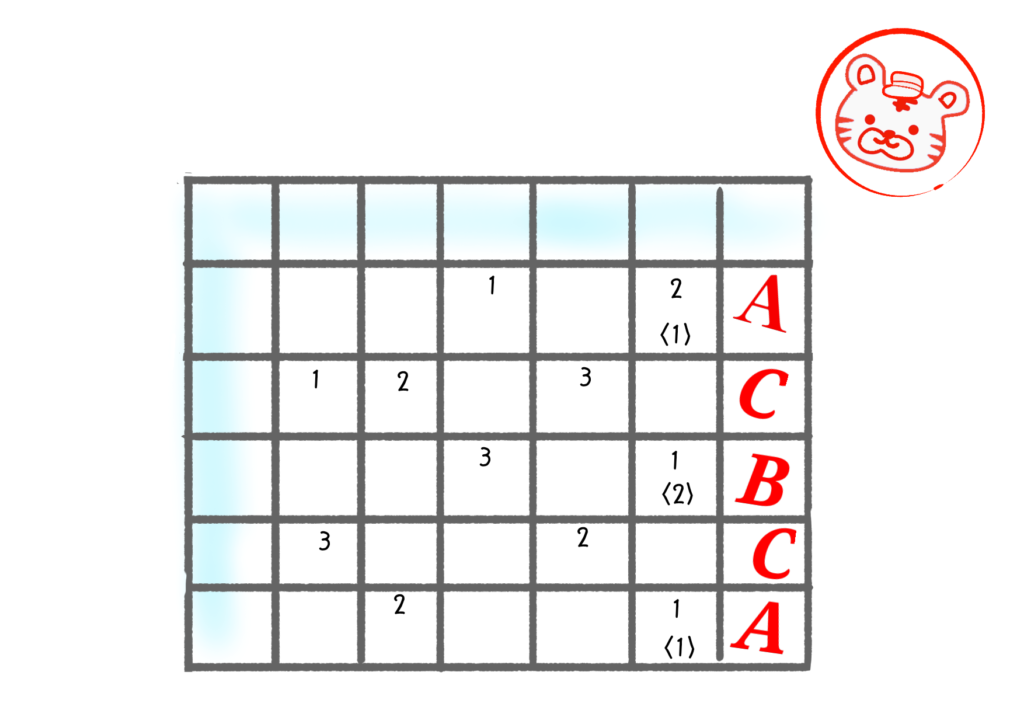
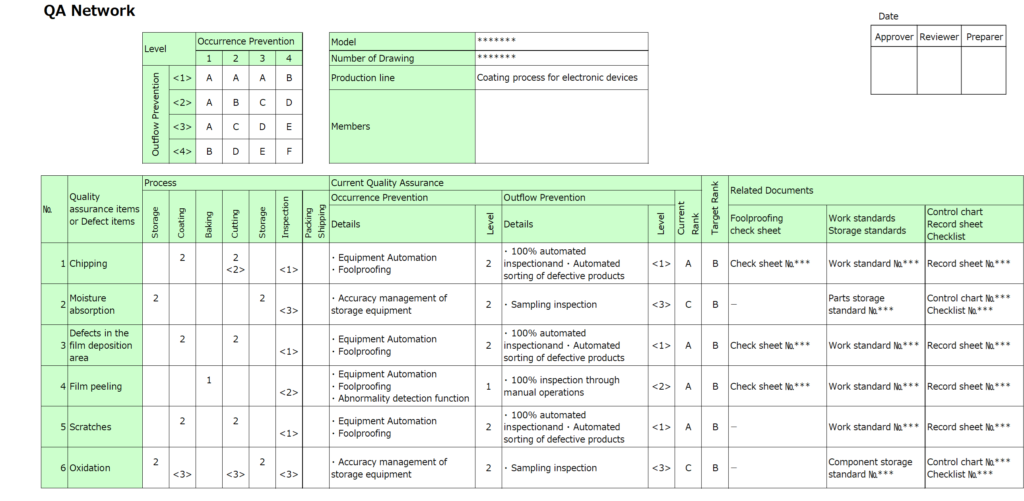
The matrix consists of items arranged vertically and horizontally, with numerical values written in two tiers at their intersections.
- The vertical axis lists quality assurance items or defect items.
- The horizontal axis represents the process steps.
At the intersections, the upper tier indicates prevention of occurrence, and the lower tier represents prevention of outflow. These are scored on a four-level scale, where smaller values signify a higher level of assurance.
The numbers at each intersection indicate the correlation between the process step and potential defect items, showing where and which defects may arise.
In short, the QA Network visualizes the level of assurance for each process step concerning quality assurance items.
Due to its mesh-like appearance, it is also referred to as a “Quality Assurance Net“.
Difference from Process FMEA
Process FMEA (Failure Mode and Effects Analysis) is a method for analyzing the degree of impact of potential defects in each process step by assigning scores.
Both methods share the common feature of correlating process steps with defect items and scoring them, which can lead to confusion.
Features of Process FMEA:
As the name suggests, Process FMEA focuses on analyzing impact.
It evaluates:
- What effects defects (failure modes) may cause.
- The degree of those effects.
It calculates risk priority, incorporating occurrence and outflow prevention, and prioritizes countermeasures for items with higher scores.
Features of the QA Network:
The standout characteristic of the QA Network is its matrix format.
A single defect does not always occur in just one process step. When defects span multiple steps, Process FMEA may risk overlooking them.
The QA Network, acting as a comprehensive “Quality Assurance Net” ensures no relevant process steps are missed, making it particularly advantageous in such scenarios.

Purpose and Applications
1. Visualizing Defects That Require Preventive Measures
The QA Network quantifies the levels of occurrence prevention and outflow prevention for each quality assurance or defect item.
By listing the current status against the target levels, it becomes easier to visually identify which items require more robust preventive measures.
2. Visualizing the Processes Where Defects Are Detected
As mentioned in the comparison with Process FMEA, the QA Network comprehensively represents defects that may span multiple process steps.
Whether a defect can be detected within the same process or only becomes apparent in subsequent processes significantly impacts its severity.
The QA Network enables easy identification of processes that adhere to the principle of self-process completion (ensuring quality within the process itself) and those that do not.
3. Materials for Customer Communication
The QA Network is not just a tool for internal analysis but can also serve as an explanatory document for customers.
One of its key advantages is the clarity of its matrix format, which provides an overview of the entire process and defect items at a glance.
Instead of lengthy textual explanations, presenting this information in a single table can be more effective.
Moreover, from a customer’s perspective, knowing that a supplier uses QA Networks for process analysis offers reassurance and helps build trust.
Steps to Preparing QA Network Sheet
Fill in the Matrix Items
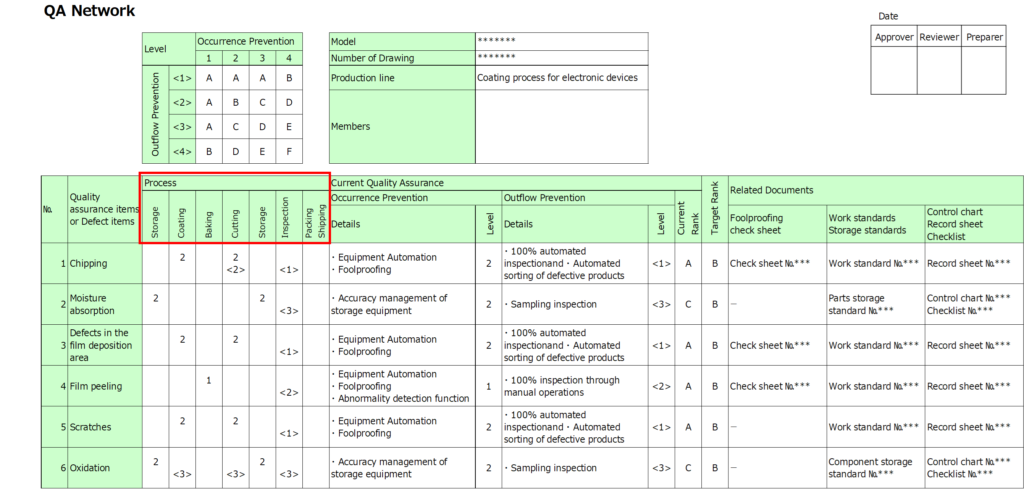
1. Horizontal Axis Items
Start by listing the process steps along the horizontal axis in accordance with the manufacturing flow.
- Ensure no steps are omitted by referencing the QC Process Chart.
2. Vertical Axis Items
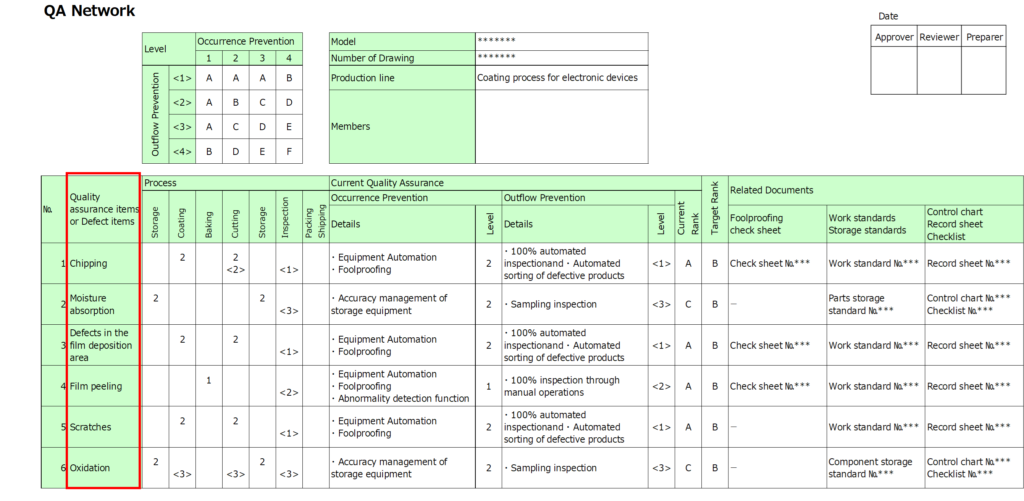
Next, list quality assurance items or defect items along the vertical axis.
- Include all items specified in drawings and inspection standards.
- Incorporate potential defect items identified during design reviews to minimize omissions.
For changes in existing designs or processes, use DRBFM (Design Review Based on Failure Mode) to identify risks related to those changes and include them in the matrix.
Assign Levels and Rankings
3. Occurrence Prevention Levels
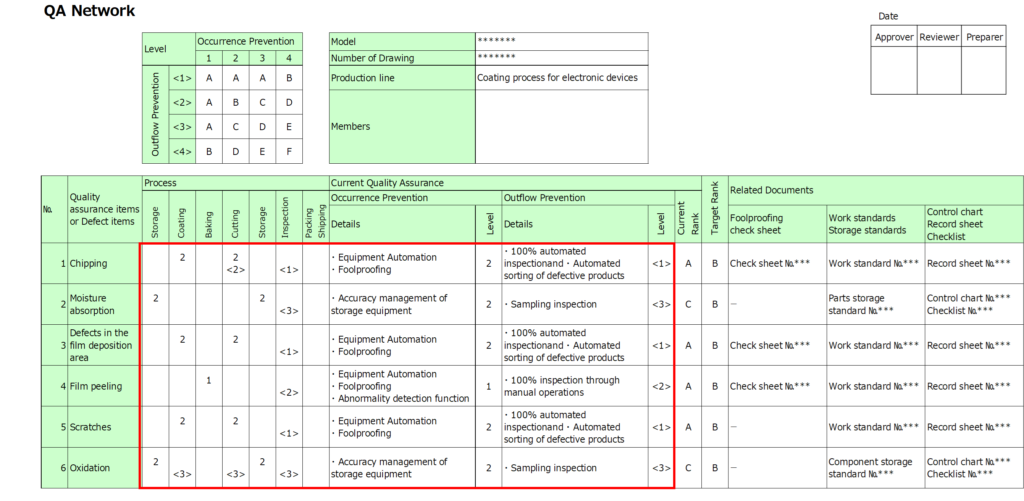
For each intersection of the matrix, indicate the occurrence prevention level in the upper cell.
- Trace each defect item through the process flow to identify where it is likely to occur.
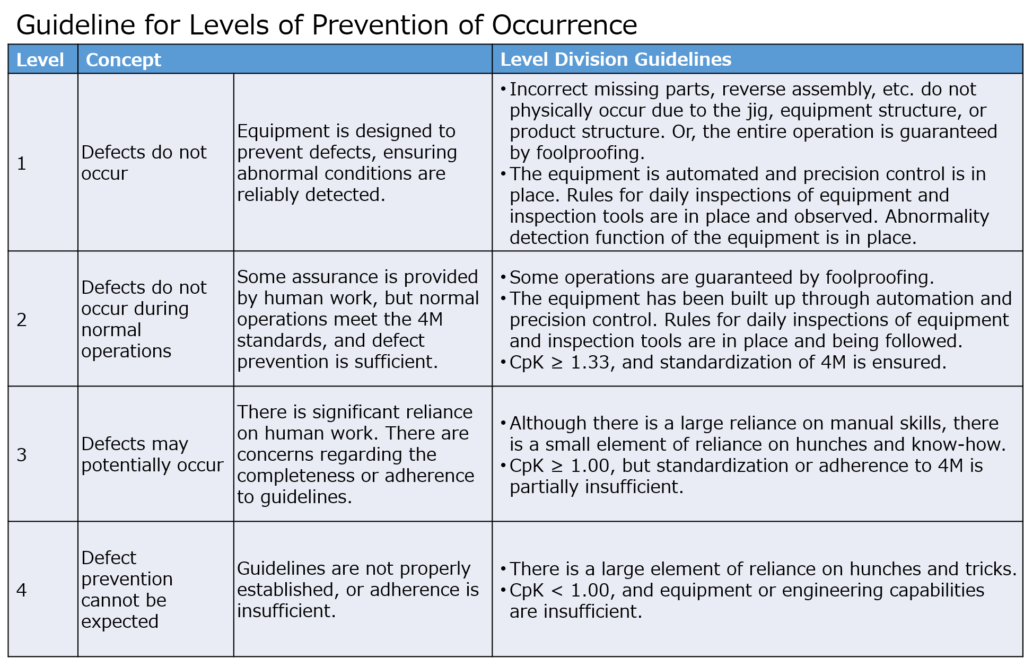
- Assign a four-level numerical value to the corresponding cell based on predefined criteria.
4. Outflow Prevention Levels
Similarly, assign outflow prevention levels in the lower cell at each intersection.
- Use the same criteria as occurrence prevention to determine these levels.
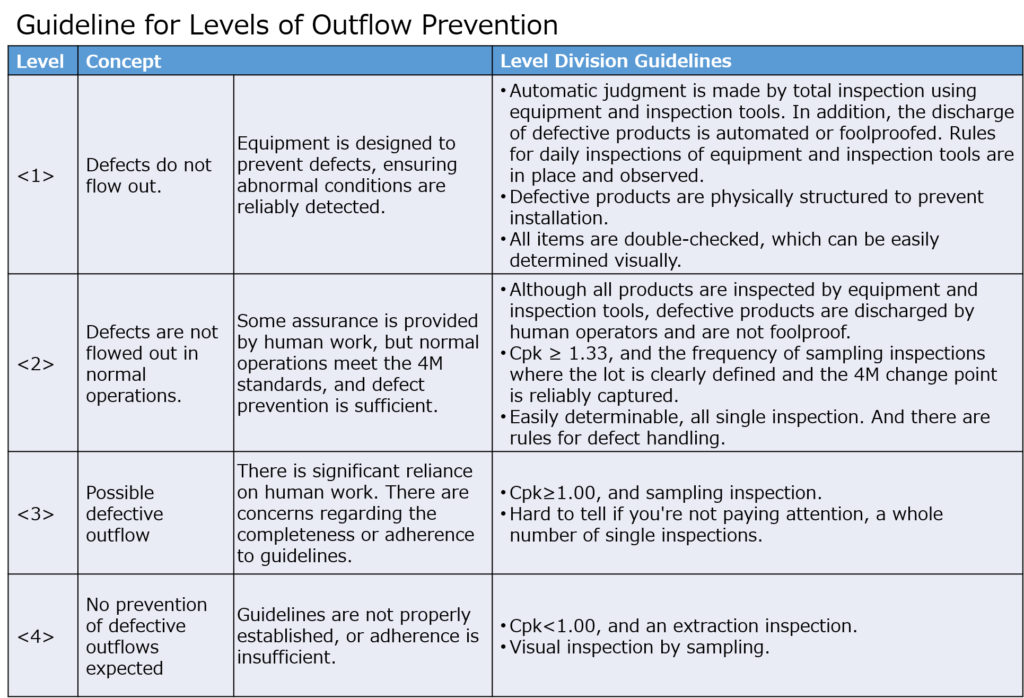
5. Current Rank and Target Rank
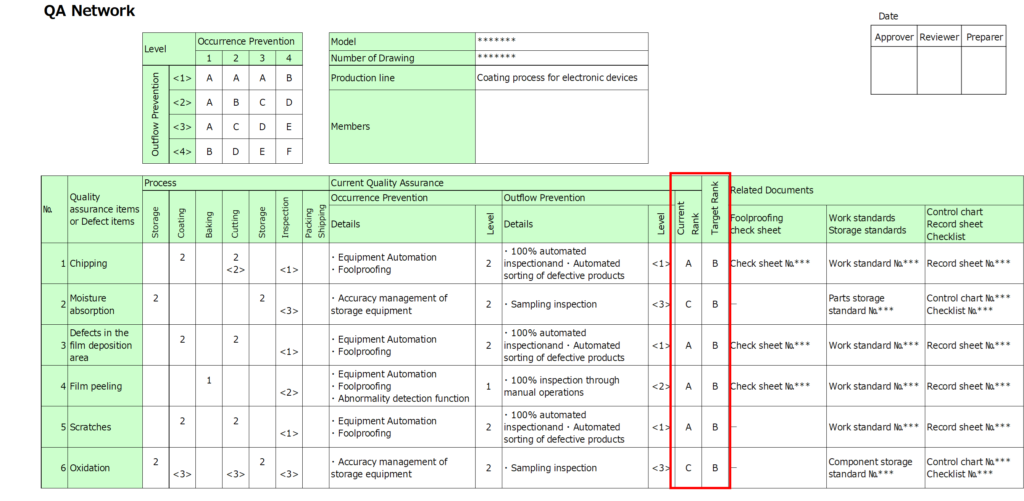
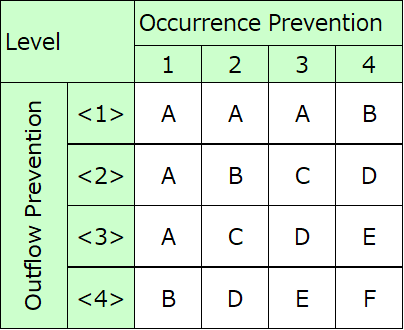
Once all occurrence and outflow prevention levels are assigned, rank each defect item based on its levels.
- Use a systematic ranking scale (e.g., A to F, six levels) to determine the rank for each defect.
- If multiple processes can prevent the outflow of a defect, choose the smallest numerical value (highest prevention level).
This ensures that even if one process fails to prevent outflow, there are multiple layers of safeguards in place, with the highest prevention level serving as the ultimate barrier.
6. Include Related Documents
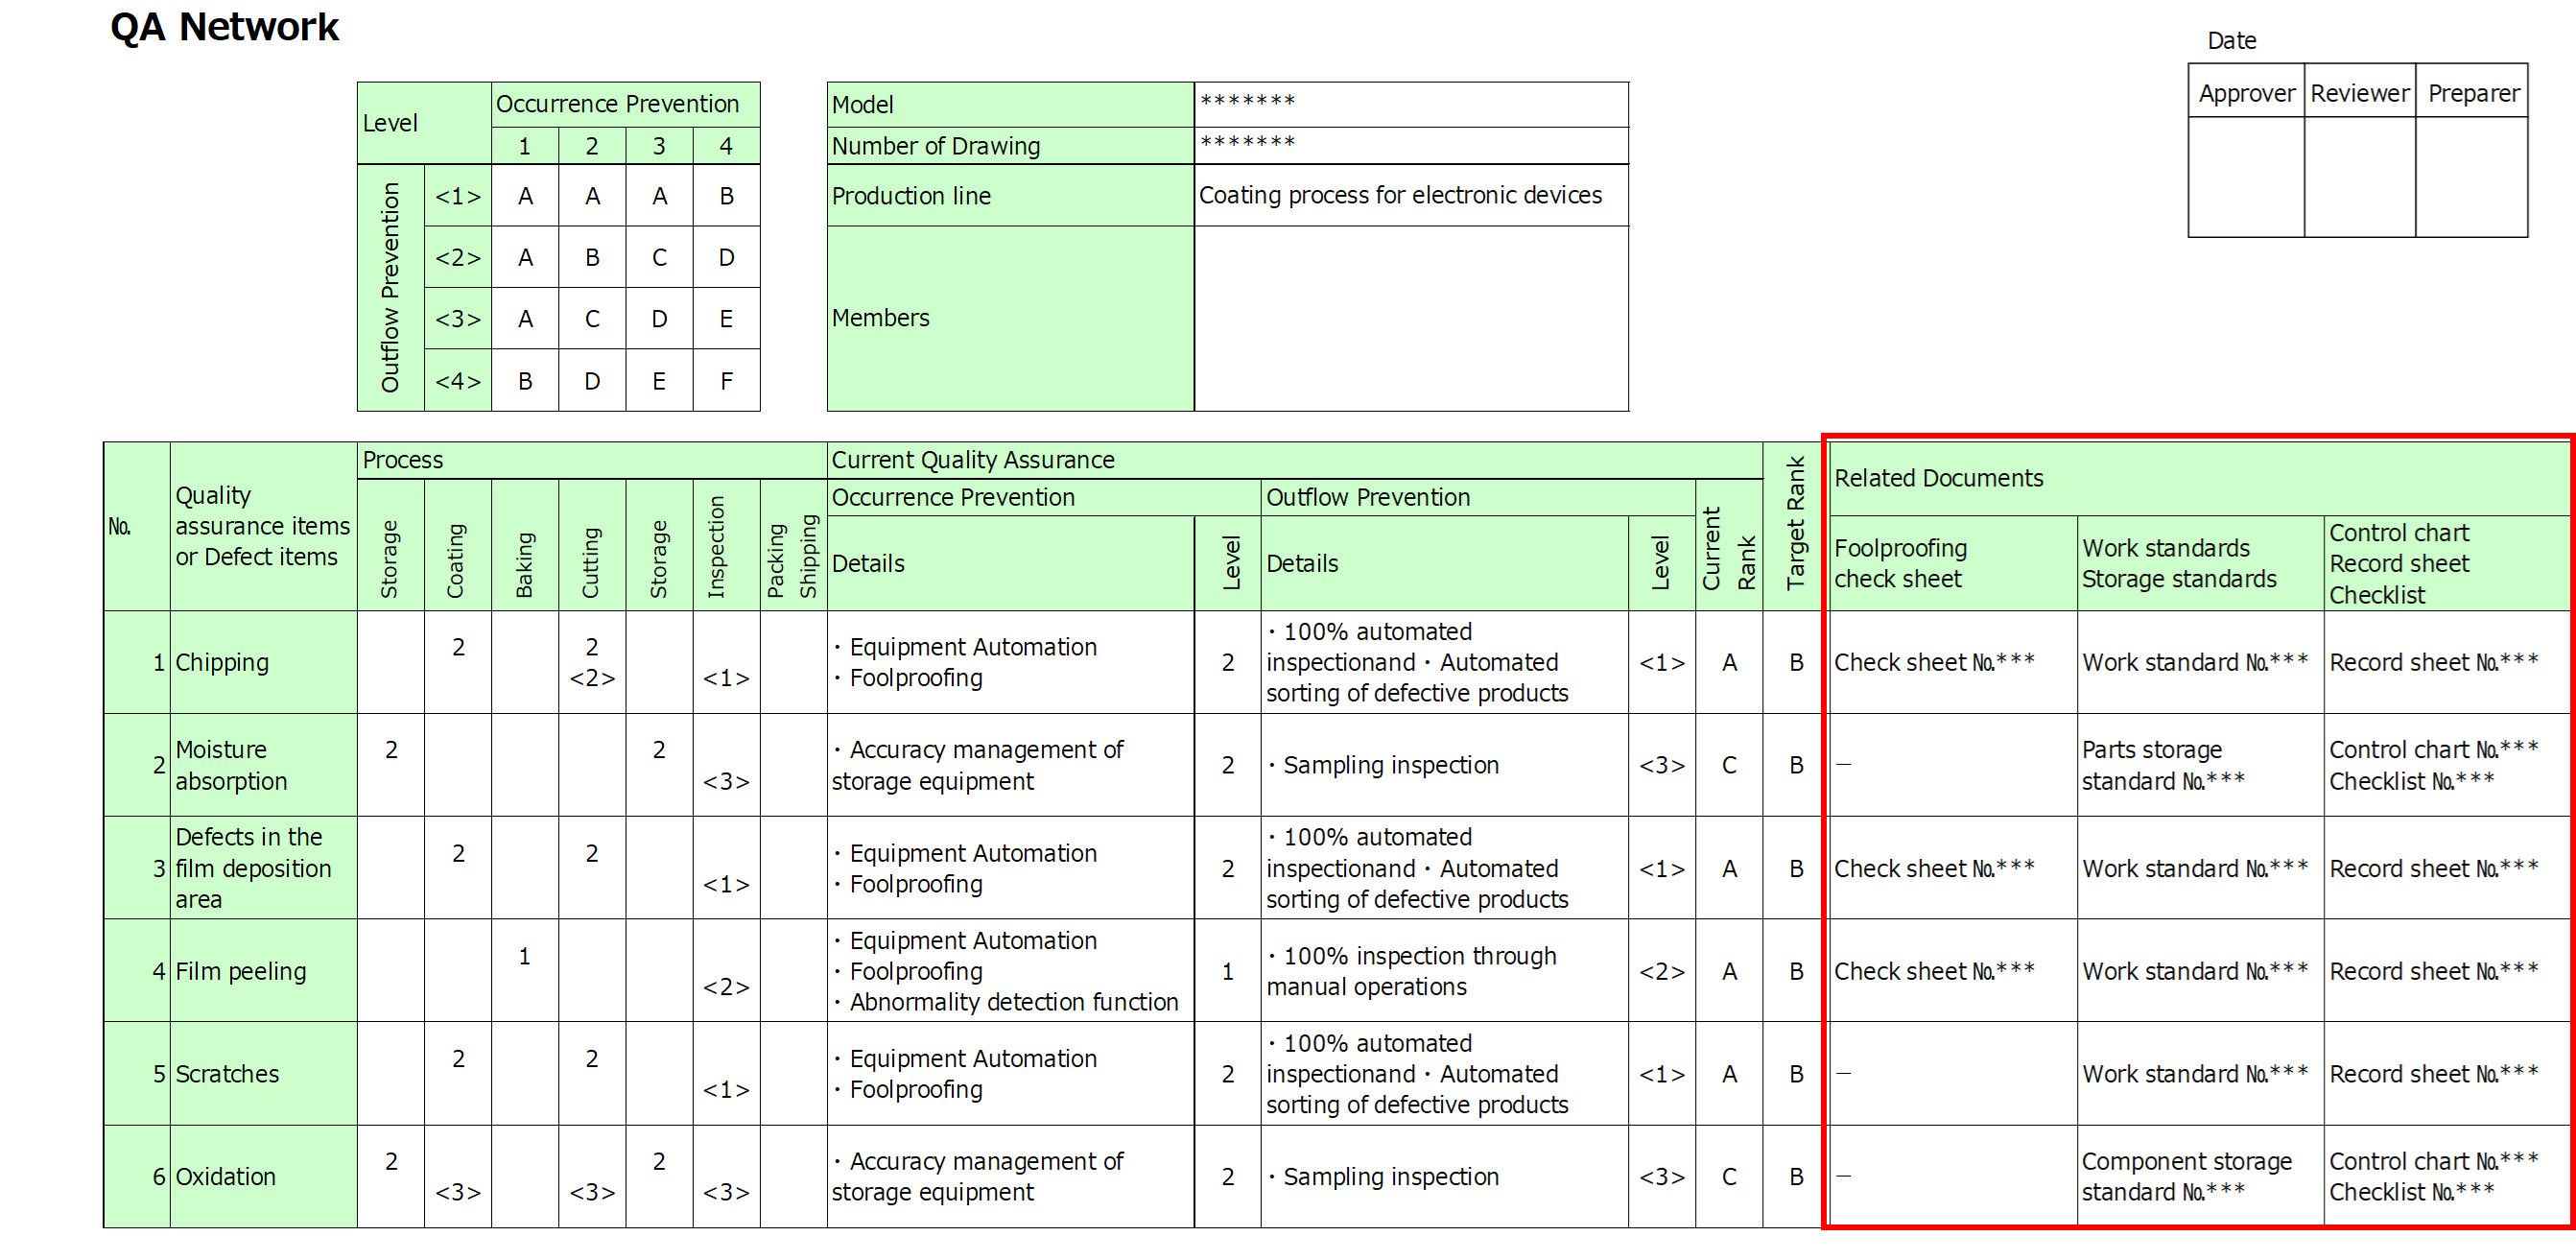
List documents such as work standards, and control charts relevant to each defect item.
Link defects to their associated documents to clearly identify how they are managed and monitored.
Summarize the Analysis Results
7. Identify Issues
Conclude the analysis by extracting key issues.
- Compare current ranks with target ranks to pinpoint weaknesses in processes or defect items.
For items that fall short of the target rank, create improvement plans and implement corrective actions.
It is important to continue through the PDCA cycle to sustain and enhance process quality.
Key Points for Preparing QA Network Sheet
1. Take Time to Extract Rows and Columns
The QA Network’s strength lies in its comprehensive visualization of assurance items and processes.
However, this comprehensiveness means that omissions during the initial creation phase can be difficult to detect later.
While level classifications can be revised and updated relatively easily, assurance items and processes cannot be adjusted as readily.
To avoid such issues, dedicate sufficient time to extracting these items at the beginning. Resist the urge to rush into level classification before ensuring all necessary items have been identified.
2. Document Specific Preventive Measures
When classifying occurrence and outflow prevention levels, include detailed descriptions of the specific preventive measures implemented.
While the classification criteria provide a general guideline, they are inherently abstract and may not apply perfectly to every situation. Without detailed documentation, it may be challenging to later recall why a specific level was assigned to an item.
By explicitly linking each item to its preventive measures, you can create a clear and actionable reference for future reviews and updates.
3. Consider Multiple Perspectives
Engage all relevant departments involved in manufacturing, such as design, production, and quality control, in the creation process.
- Discrepancies in Perspectives:
For example, the design department may expect a certain level of outflow prevention, while the quality control team might have a more realistic understanding based on actual performance. - Shared Insights:
Additionally, the production team might identify defect occurrence processes overlooked by the design team.
Since different departments have unique criteria for scoring and evaluating processes, incorporating diverse perspectives ensures more objective and balanced ranking.
By fostering cross-functional collaboration, you can develop a QA Network that more accurately reflects the true state of your processes.
Summary
QA Network
QA Network is an analytical method that uses a matrix to align quality assurance items with process steps, enabling the quantification and identification of which processes prevent the occurrence and outflow of defects.
Difference from Process FMEA
- FMEA: Focuses on analyzing the “impact” of failure modes on the product.
- QA Network: Useful for comprehensively identifying defects across multiple processes.
Purpose and Applications
- Visualizing defects requiring preventive measures
- Visualizing processes where defects are detected
- Serving as explanatory material for customers
Key Points When Preparing QA Network Sheet
- Spend adequate time extracting rows (assurance items) and columns (processes).
- Document specific preventive measures alongside level classifications.
- Approach from multiple perspectives through cross-functional collaboration.
While the final QA Network chart may seem complex at first glance, following the outlined steps makes its creation manageable.
By utilizing a QA Network, you can better evaluate the robustness of your quality assurance processes and ensure that they are as comprehensive and effective as possible.
Thank you for reading to the end!




コメント