“What are the benefits of using FTA?”
“What kind of format does it use?”
“I want to know the steps for creating a tree diagram.”
This article is for those who have such questions or concerns.
FTA (Fault Tree Analysis) is an essential tool for investigating the causes of failures, and it’s no exaggeration to say that anyone involved in manufacturing cannot avoid it.
However, if you start looking into how to use FTA tool only after a problem arises, your initial response may be delayed.
That’s why it’s important to understand the structure of FTA, the steps to create it, and key points in the approach in advance.
This article explains the basics as clearly as possible so even first-timers can understand. I hope it will be helpful to you all!
What is FTA?
FTA stands for Fault Tree Analysis.
It is an analytical method used for comprehensive cause investigation by creating a tree diagram that breaks down the factors contributing to a failure event into hierarchical layers.
This top-down analysis method starts with identifying the target failure event, then decomposes it into its underlying elements moving downward.
Structure of FTA
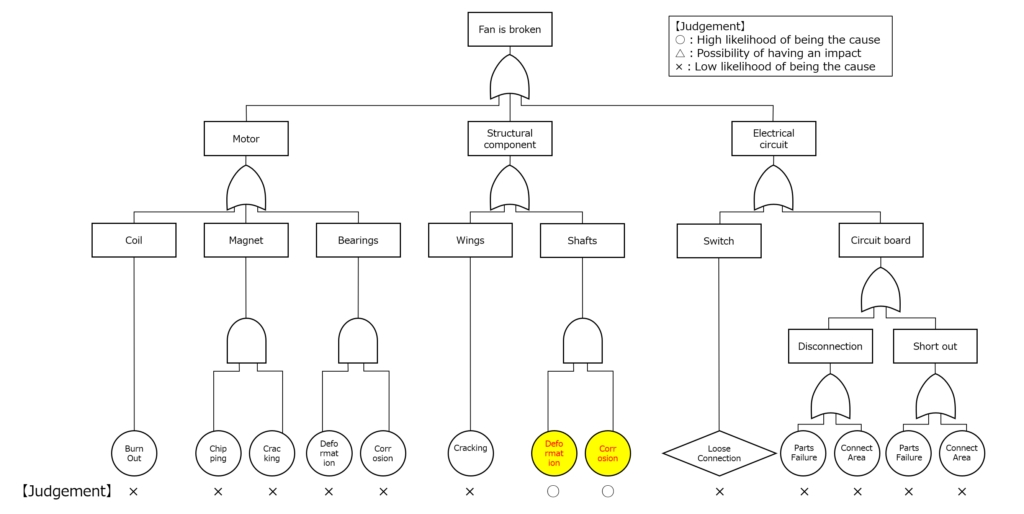
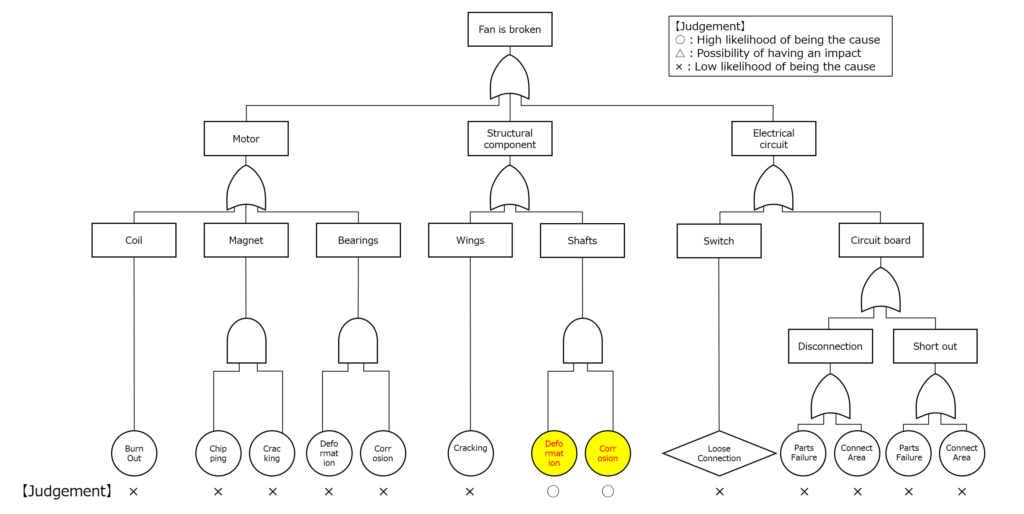
Here is an example format of FTA tree diagram.
At the very top is the target failure event, referred to as the “top event.”
From there, elements (events) are broken down in a tree-like structure, moving from the top to the bottom of the diagram. A distinguishing feature of this method is the use of logical symbols placed between events to connect them.
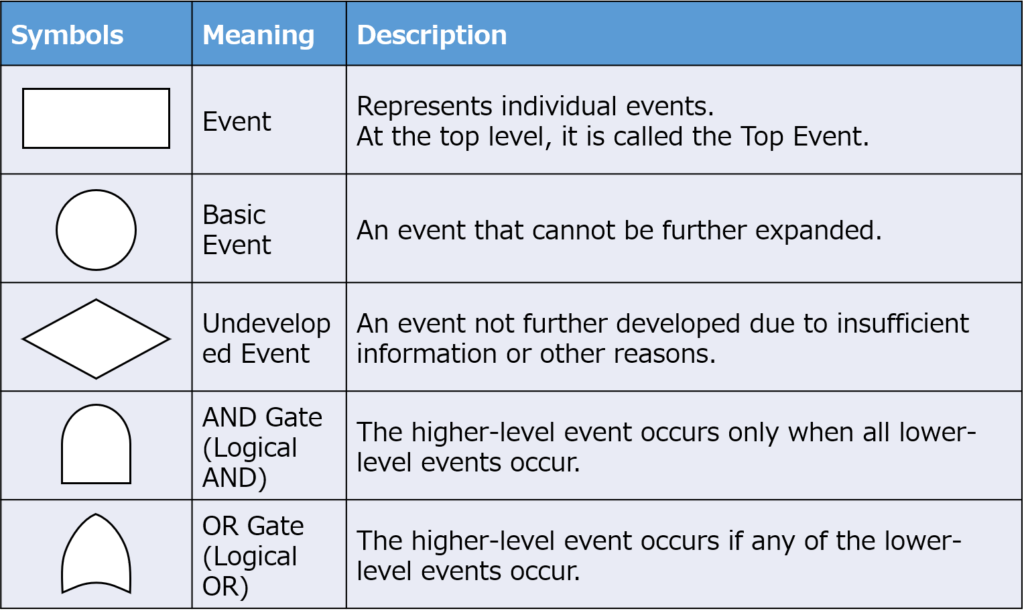
The meanings of each symbol in the diagram are as follows:
Difference from FMEA
Additionally, there is another method for failure mode analysis called FMEA (Failure Mode and Effects Analysis).
FMEA is an analytical method that ranks potential failure modes of a product in advance, visualizes items with high scores, and determines countermeasures and priorities accordingly.
The major difference between the two methods lies in their objectives:
- FTA is used for investigating the causes of failures.
- FMEA is used for preventing failures before they occur.
FMEA is a bottom-up analytical approach where all potential failure modes are initially listed, and countermeasures are considered for each element. Understanding this key difference between FTA and FMEA will be beneficial.

Purpose and Applications
1. Investigation of Failure Causes
By expressing causes hierarchically, FTA helps to organize information in a visually clear manner.
When multiple factors interact complexly or when the specific cause cannot be pinpointed and several possibilities remain, visualizing the analysis as a diagram makes it easier for others to understand.
2. Listing of Failure Factors
FTA extracts not only direct causes of failure but also potential influencing factors comprehensively, enabling a complete list of possible contributors.
Even if a factor is not the direct cause in the current situation, changes in conditions may shift the underlying cause.
By listing and identifying factors upfront, you can use the analysis for similar issues in the future, ensuring quicker initial responses to investigations.
3. Estimation of Occurrence Probability
If probabilities for individual events are quantified, you can calculate the probability of higher-level events under AND conditions by multiplying the probabilities of the contributing factors.
Visual diagrams clarify which elements to multiply, making the process intuitive and effective.
Two Types of FTA Formats
FTA is defined as a system reliability analysis technique, and the use of logical symbols is specified in previously explained format.
In manufacturing settings, however, another format is commonly used.
This alternative does not rely on logical symbols but instead uses hierarchical categories such as primary and secondary causes, similar to methods like “5 Whys” or “Tree diagram method”.
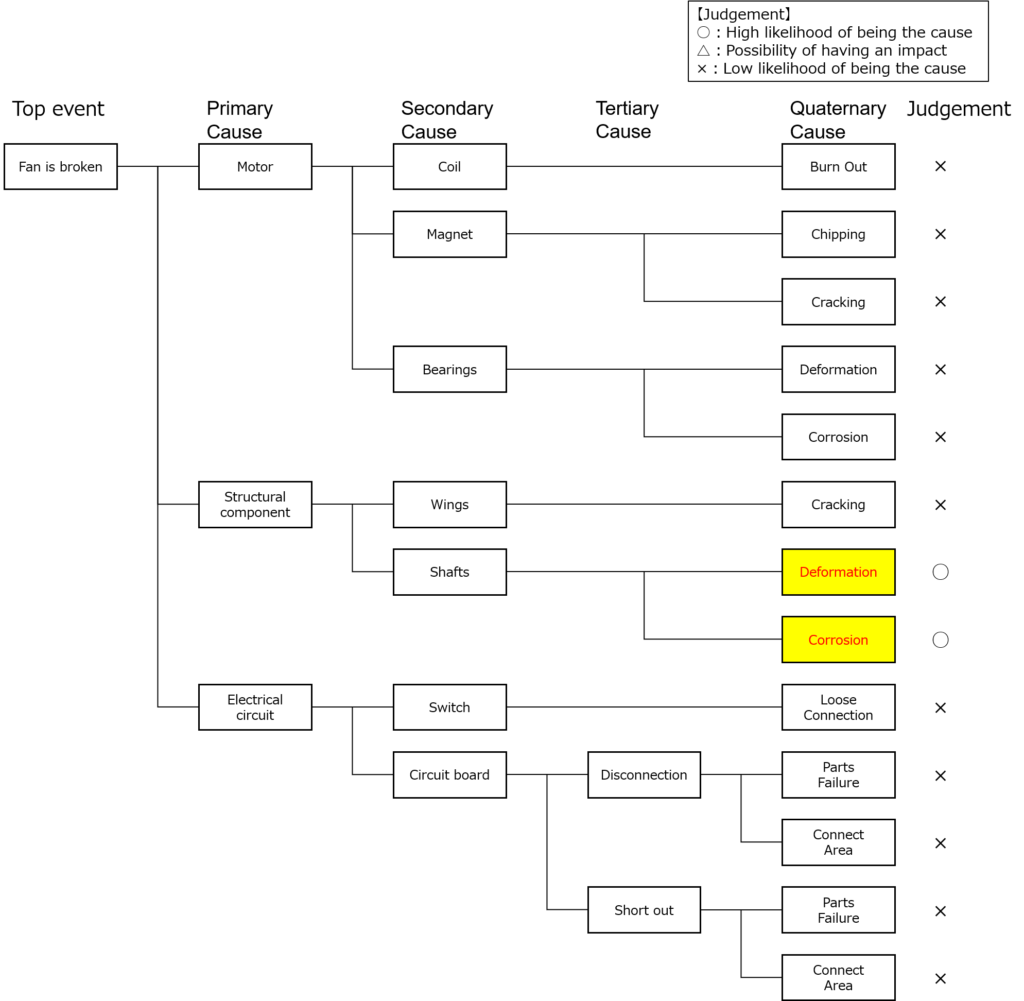
While there are no strict rules for selecting the format, practical experience suggests that the choice depends on how primary factors are categorized.
For example, when using logical symbols, this method—originally intended for system analysis—is often applied to classify factors based on a product’s structural components.
Viewing a product as a system, you can apply AND and OR logic to determine whether a single component failure causes the issue or if fail-safe functions are in place.
Conversely, when categorizing by process steps or using the 4M framework (Man, Machine, Material, Method), independent factors are often better explored using iterative cause-and-effect diagrams.
Procedure for Preparing FTA tree diagram
Here is a step-by-step guide to creating an FTA using a practical example: a fan that fails to operate.
The structure of an FTA diagram can expand downward from the top or horizontally from the left. Choose the layout that feels most comfortable to you.
The procedure remains the same regardless of whether you use logical symbols or not.
Step1. Clarify Preconditions and Record the Top Event
The “Top Event” represents the failure event, but before documenting it, pause to clarify preconditions.
FTA aims to investigate the causes of the top event, so ensure the analysis aligns with your investigation’s objective.
For example, consider the failure mode “The fan won’t work.” Depending on the context, the potential causes differ significantly:
Case1: Initial Failure
If a brand-new product does not work from the start, possible causes include pre-existing issues such as broken wiring or missing components.
Conversely, deterioration modes like burned-out windings due to usage are likely to be excluded as failure causes in this case.
Case2: Aging and Intermittent Operation
A fan that sometimes works may indicate wear-related issues, such as contact failures.
Case3: Complete Failure due to Aging
In this case, it corresponds to scenarios such as a motor burning out.
Once it fails due to aging, it reaches a state where it will no longer function at all.
As shown here, even in a “non-operational” mode, differing initial conditions can lead to entirely different root causes.
Therefore, it is essential to gather accurate information about the incident.
Step2. Identify Primary Factors
After organizing the investigation objectives and top event, extract primary factors.
Categories might include structural components, process steps, or the 4M framework.
Preparing several formats in advance will streamline this step.

Step3. Extract Secondary and Lower-Level Factors
Decompose primary factors into secondary factors and beyond.
For product structures, start with major units and progressively break them down into individual components.
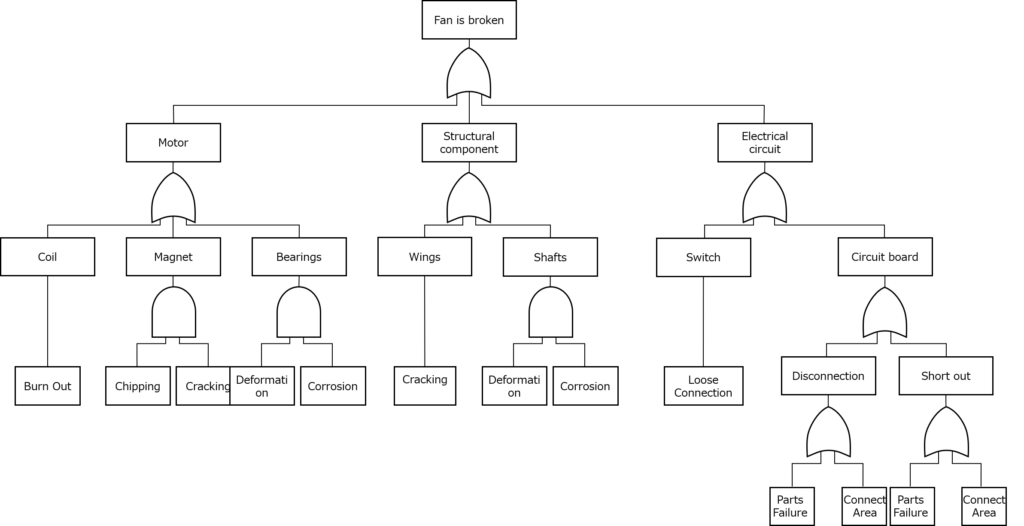
If categorizing by process, begin with broad categories and refine them into detailed steps or equipment elements.
Continue asking “why” to dive deeper until reaching the smallest units of analysis.
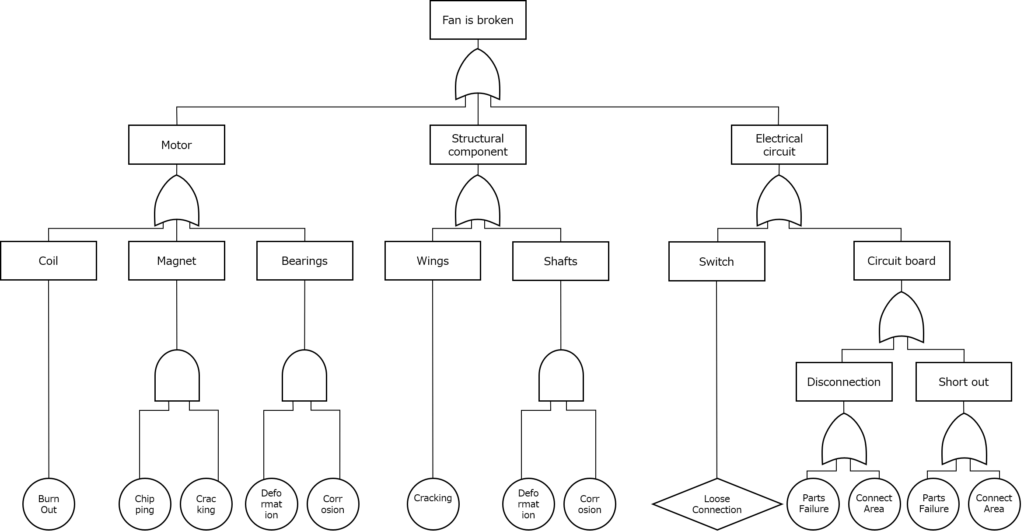
Step4. Refine Logical Symbols
Once factors are extracted, refine the logical symbols.
Fully decomposed elements can be marked with circles.
Elements that cannot be further analyzed due to insufficient information can be represented with diamonds.
Step5. Record Judgments
For each factor, indicate its likelihood as follows:
○: High likelihood of being the cause
△: Possibility of having an impact
×: Low likelihood of being the cause
Step6. Plan Additional Investigations
It’s acceptable if no “○” factors are identified at this stage.
Use the “△” factors to guide further evaluations and investigations to isolate the root cause.
Key Points for Preparing FTA
Define Preconditions Clearly
Incorrect preconditions render the FTA ineffective.
Thoroughly investigate the “when,” “where,” and “how” of the failure event.
Identify Needs for Cause Isolation
While some “△” factors will remain, consider what comparisons, tests, or evaluations can clarify these causes during the analysis process.
Document with Supporting Evidence
Completing the failure investigation and filling out the FTA does not mean that everything is resolved.
It is common to see cases where only the FTA is completed and the process ends there. However, a third party looking at this document alone would not be able to understand the investigation’s context or the reasoning behind the decisions.
Therefore, make it a standard practice to compile the supporting evidence that led to the root cause identification along with the FTA as part of the technical documentation.
Summary
- FTA (Fault Tree Analysis)
A hierarchical, tree-diagram-based method for comprehensive investigation of failure causes.
A top-down approach, starting from the failure event (top event) and breaking it down into contributing factors. - Purpose and Applications
Failure cause investigation.
Comprehensive listing of contributing factors.
Estimation of occurrence probabilities. - Creation Steps
1: Clarify preconditions and record the top event.
2: Identify primary factors.
3: Extract secondary and lower-level factors.
4: Refine logical symbols.
5: Record judgments.
6: Plan additional investigations. - Key Points for Preparing FTA:
Clearly define preconditions.
Consider what is needed for isolating causes.
Save as a resource with supporting evidence.
FTA is a powerful tool for systematically and comprehensively investigating causes.
While initial creation may take time, once you develop the methodology and format, the process becomes more efficient.
Make it a habit to create an FTA whenever issues arise to facilitate quicker and more effective investigations.
Thank you for reading to the end!




コメント