
概要
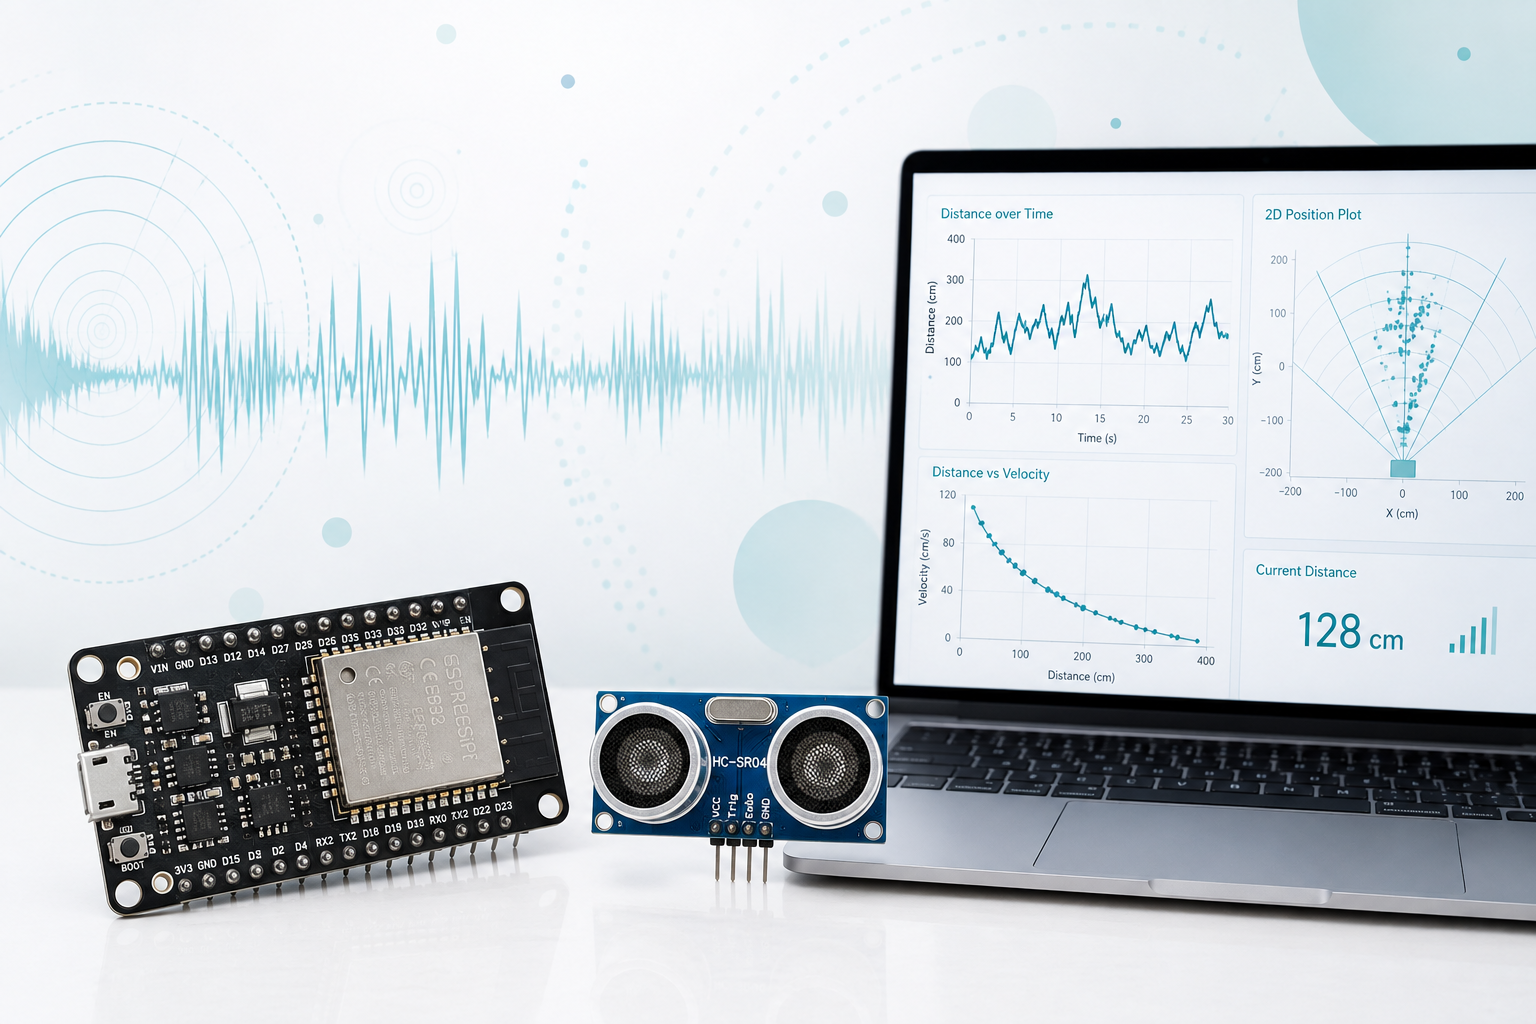
今回は、HC-SR04を3個使って、対象物の2D位置推定に挑戦します。
これまでの回では、1個の超音波センサーで距離測定、速度計算、状態判定、機械学習分類を行ってきました。
第8回では、センサーを3個に増やし、三辺測量の考え方で対象物が2Dマップ上のどこにあるかを推定します。
Python側では、探索エリア内に候補点を作り、各候補点から3つのセンサーまでの距離を計算します。
実測距離との差が一番小さい点を、対象物の推定位置としてリアルタイム表示します。
ちょっとしたデジタル化のトライアルをお考えの方に、少しでも参考になればうれしいです。
詳しくは、以下のYouTube動画をご覧ください。

配線
プログラムコード
マイコン(ESP32)
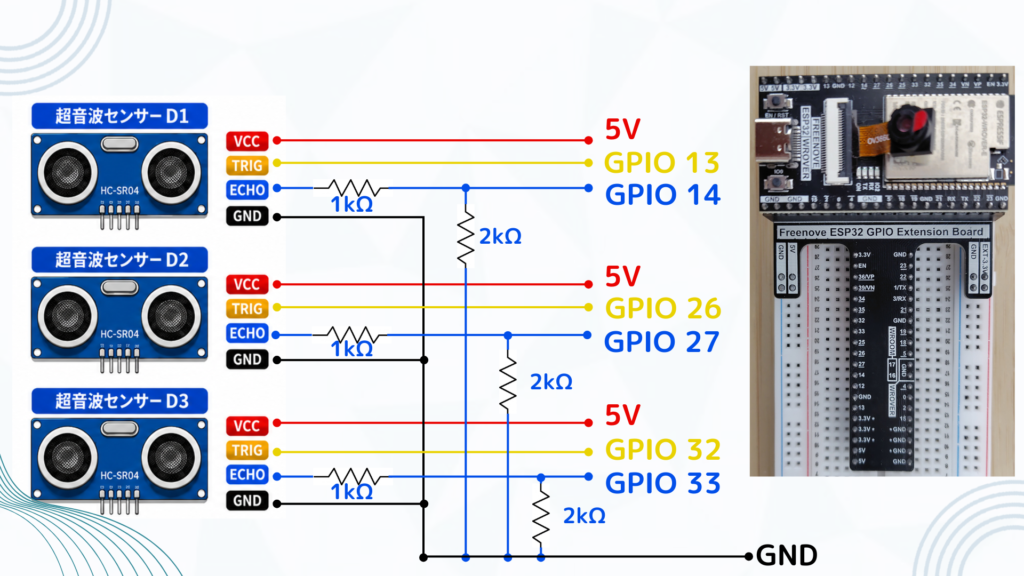
- HC-SR04を3個接続し、それぞれの距離を測定
- センサー同士の干渉を避けるため、D1→D2→D3の順番で測定
- 各センサーで3回測定し、中央値または有効値の平均を代表値にする
- タイムアウトや測定範囲外の値は 「
nan」 として扱う - 測定結果を 「
D1:xx.xx,D2:xx.xx,D3:xx.xx」 の形式でシリアル出力 - Python側で読み取りやすい形式にして、3つの距離データを送信
/**********************************************************************
  3 Ultrasonic Sensors with ESP32
  Description:
    - HC-SR04を3個使用
    - 3つのセンサーを順番に測定
    - センサー間の干渉を避けるため、同時には測定しない
    - Pythonで読み取りやすい形式でシリアル出力

  Serial Output Example:
    D1:23.45,D2:31.20,D3:28.76
**********************************************************************/

// ==================================================
// ▼ここだけ設定すればOK
// ==================================================

// Sensor 1
const int TRIG_PIN_1 = 13;
const int ECHO_PIN_1 = 14;

// Sensor 2
const int TRIG_PIN_2 = 26;
const int ECHO_PIN_2 = 27;

// Sensor 3
const int TRIG_PIN_3 = 32;
const int ECHO_PIN_3 = 33;

// シリアル通信速度
const long BAUD_RATE = 115200;

// 音速 [cm/us]
// 20℃付近では約0.0343 cm/us
const float SOUND_SPEED_CM_PER_US = 0.0343;

// 測定タイムアウト [us]
// 30000us ≒ 約5m相当
const unsigned long TIMEOUT_US = 30000;

// センサー同士の干渉を避ける待ち時間 [ms]
const int SENSOR_INTERVAL_MS = 80;

// 1サイクルごとの待ち時間 [ms]
const int LOOP_INTERVAL_MS = 100;

// 異常値として扱う距離範囲 [cm]
const float MIN_DISTANCE_CM = 2.0;
const float MAX_DISTANCE_CM = 400.0;

// 各センサーで何回測って中央値を使うか
// 1でもよいですが、3にすると少し安定します
const int SAMPLE_COUNT = 3;


// ==================================================
// 距離を1回測定する関数
// ==================================================

float measureOnceCm(int trigPin, int echoPin) {
  // TRIGを一度LOWにして安定化
  digitalWrite(trigPin, LOW);
  delayMicroseconds(2);

  // 10usのパルスを出す
  digitalWrite(trigPin, HIGH);
  delayMicroseconds(10);
  digitalWrite(trigPin, LOW);

  // ECHOのHIGH時間を測定
  unsigned long duration = pulseIn(
    echoPin,
    HIGH,
    TIMEOUT_US
  );

  // タイムアウトした場合
  if (duration == 0) {
    return NAN;
  }

  // 往復時間なので2で割る
  float distanceCm = duration * SOUND_SPEED_CM_PER_US / 2.0;

  // 範囲外は無効値
  if (
    distanceCm < MIN_DISTANCE_CM ||
    distanceCm > MAX_DISTANCE_CM
  ) {
    return NAN;
  }

  return distanceCm;
}


// ==================================================
// 3点の中央値を求める関数
// ==================================================

float median3(float a, float b, float c) {
  if (isnan(a) && isnan(b) && isnan(c)) {
    return NAN;
  }

  // NANを含む場合は、有効値の平均にする
  float sum = 0.0;
  int count = 0;

  if (!isnan(a)) {
    sum += a;
    count++;
  }

  if (!isnan(b)) {
    sum += b;
    count++;
  }

  if (!isnan(c)) {
    sum += c;
    count++;
  }

  if (count == 1) {
    return sum;
  }

  if (count == 2) {
    return sum / 2.0;
  }

  // 3つとも有効な場合は中央値
  if (a > b) {
    float temp = a;
    a = b;
    b = temp;
  }

  if (b > c) {
    float temp = b;
    b = c;
    c = temp;
  }

  if (a > b) {
    float temp = a;
    a = b;
    b = temp;
  }

  return b;
}


// ==================================================
// 複数回測定して代表値を返す関数
// ==================================================

float measureDistanceCm(int trigPin, int echoPin) {
  if (SAMPLE_COUNT <= 1) {
    return measureOnceCm(trigPin, echoPin);
  }

  // 今回はSAMPLE_COUNT = 3を想定
  float d1 = measureOnceCm(trigPin, echoPin);
  delay(20);

  float d2 = measureOnceCm(trigPin, echoPin);
  delay(20);

  float d3 = measureOnceCm(trigPin, echoPin);

  return median3(d1, d2, d3);
}


// ==================================================
// シリアル出力用関数
// ==================================================

void printDistanceValue(float value) {
  if (isnan(value)) {
    Serial.print("nan");
  } else {
    Serial.print(value, 2);
  }
}


// ==================================================
// 初期設定
// ==================================================

void setup() {
  Serial.begin(BAUD_RATE);

  pinMode(TRIG_PIN_1, OUTPUT);
  pinMode(ECHO_PIN_1, INPUT);

  pinMode(TRIG_PIN_2, OUTPUT);
  pinMode(ECHO_PIN_2, INPUT);

  pinMode(TRIG_PIN_3, OUTPUT);
  pinMode(ECHO_PIN_3, INPUT);

  digitalWrite(TRIG_PIN_1, LOW);
  digitalWrite(TRIG_PIN_2, LOW);
  digitalWrite(TRIG_PIN_3, LOW);

  delay(1000);

  Serial.println("3 Ultrasonic Sensors Ready");
  Serial.println("Output format: D1:xx.xx,D2:xx.xx,D3:xx.xx");
}


// ==================================================
// メイン処理
// ==================================================

void loop() {
  // ----------------------------------------------
  // Sensor 1 測定
  // ----------------------------------------------

  float distance1 = measureDistanceCm(
    TRIG_PIN_1,
    ECHO_PIN_1
  );

  delay(SENSOR_INTERVAL_MS);

  // ----------------------------------------------
  // Sensor 2 測定
  // ----------------------------------------------

  float distance2 = measureDistanceCm(
    TRIG_PIN_2,
    ECHO_PIN_2
  );

  delay(SENSOR_INTERVAL_MS);

  // ----------------------------------------------
  // Sensor 3 測定
  // ----------------------------------------------

  float distance3 = measureDistanceCm(
    TRIG_PIN_3,
    ECHO_PIN_3
  );

  delay(SENSOR_INTERVAL_MS);

  // ----------------------------------------------
  // Pythonで読み取りやすい形式で出力
  // ----------------------------------------------

  Serial.print("D1:");
  printDistanceValue(distance1);

  Serial.print(",D2:");
  printDistanceValue(distance2);

  Serial.print(",D3:");
  printDistanceValue(distance3);

  Serial.println();

  delay(LOOP_INTERVAL_MS);
}
Python
- ESP32から3つの超音波センサーの距離データを受信
D1:xx,D2:xx,D3:xxの形式から距離値を抽出- 各センサーの距離データを移動平均で平滑化
- 探索エリア内に候補点を作成し、各候補点からセンサーまでの距離を計算
- 実測距離との差が最も小さい候補点を、対象物の推定位置とする
- 推定位置を移動平均で平滑化
- 推定誤差に応じて、GOOD、CHECK、UNCERTAIN、NO DATAに分類
- センサー位置、探索エリア、距離円、推定位置を2Dマップに表示
- 推定位置の色を、精度ステータスに応じて変える
- 距離データ、推定座標、誤差、ステータスをCSVに保存
from pathlib import Path
import re
import csv
import time
from collections import deque

import serial
import numpy as np
import matplotlib.pyplot as plt
from matplotlib.animation import FuncAnimation
from matplotlib.patches import Circle


# ==================================================
# ▼ここだけ設定すればOK
# ==================================================

# シリアル通信設定
PORT = "COM5"
BAUDRATE = 115200

# ==================================================
# センサー配置 [cm]
#
# 浅い三角形配置
#
# D3             D2             D1
# (0,0)        (25,5)         (50,0)
#
# 3つのセンサーは中心付近 (25,35) に向ける
# ==================================================

SENSOR_POSITIONS = {
    "D1": (50.0, 0.0),
    "D2": (25.0, 5.0),
    "D3": (0.0, 0.0),
}

# 表示範囲 [cm]
X_MIN = -5.0
X_MAX = 55.0
Y_MIN = -5.0
Y_MAX = 60.0

# 位置推定に使う探索範囲 [cm]
# 検知角度が狭い前提で、中央寄りに限定
SEARCH_X_MIN = 12.0
SEARCH_X_MAX = 38.0
SEARCH_Y_MIN = 20.0
SEARCH_Y_MAX = 55.0

# グリッド探索の刻み [cm]
GRID_STEP_CM = 0.5

# 距離の有効範囲 [cm]
MIN_DISTANCE_CM = 2.0
MAX_DISTANCE_CM = 120.0

# 距離の移動平均窓幅
DISTANCE_SMOOTH_WINDOW = 7

# 推定座標の移動平均窓幅
POSITION_SMOOTH_WINDOW = 7

# 誤差ステータス判定 [cm]
# error_rms が小さいほど精度が高い
GOOD_ERROR_CM = 2.0
CHECK_ERROR_CM = 5.0

# グラフ更新周期 [ms]
UPDATE_INTERVAL_MS = 100

# 距離円を表示するか
SHOW_DISTANCE_CIRCLES = True

# ログ保存
OUTPUT_DIR = Path("logs")
OUTPUT_CSV_FILE = OUTPUT_DIR / "ultrasonic_2d_position_log.csv"


# ==================================================
# 出力フォルダ作成
# ==================================================

OUTPUT_DIR.mkdir(
    parents=True,
    exist_ok=True
)


# ==================================================
# センサー座標の準備
# ==================================================

sensor_names = ["D1", "D2", "D3"]

sensor_xy = np.array([
    SENSOR_POSITIONS[name]
    for name in sensor_names
], dtype=float)


# ==================================================
# グリッド探索用の候補点を事前作成
# ==================================================

x_values = np.arange(
    SEARCH_X_MIN,
    SEARCH_X_MAX + GRID_STEP_CM,
    GRID_STEP_CM
)

y_values = np.arange(
    SEARCH_Y_MIN,
    SEARCH_Y_MAX + GRID_STEP_CM,
    GRID_STEP_CM
)

grid_x, grid_y = np.meshgrid(
    x_values,
    y_values
)

candidate_points = np.column_stack([
    grid_x.ravel(),
    grid_y.ravel()
])

# 各候補点から各センサーまでの距離を事前計算
candidate_distances = np.zeros(
    (candidate_points.shape[0], len(sensor_names))
)

for i, (sx, sy) in enumerate(sensor_xy):
    candidate_distances[:, i] = np.sqrt(
        (candidate_points[:, 0] - sx) ** 2
        +
        (candidate_points[:, 1] - sy) ** 2
    )


# ==================================================
# 平滑化用バッファ
# ==================================================

distance_buffers = {
    "D1": deque(maxlen=DISTANCE_SMOOTH_WINDOW),
    "D2": deque(maxlen=DISTANCE_SMOOTH_WINDOW),
    "D3": deque(maxlen=DISTANCE_SMOOTH_WINDOW),
}

position_x_buffer = deque(maxlen=POSITION_SMOOTH_WINDOW)
position_y_buffer = deque(maxlen=POSITION_SMOOTH_WINDOW)


# ==================================================
# 現在値
# ==================================================

latest_distances_raw = {
    "D1": np.nan,
    "D2": np.nan,
    "D3": np.nan,
}

latest_distances_smooth = {
    "D1": np.nan,
    "D2": np.nan,
    "D3": np.nan,
}

latest_position = {
    "x": np.nan,
    "y": np.nan,
    "x_smooth": np.nan,
    "y_smooth": np.nan,
    "error_rms": np.nan,
    "status": "NO DATA",
}

latest_raw_text = ""

start_time = time.time()


# ==================================================
# CSV保存準備
# ==================================================

csv_file = open(
    OUTPUT_CSV_FILE,
    mode="w",
    newline="",
    encoding="utf-8-sig"
)

csv_writer = csv.writer(csv_file)

csv_writer.writerow([
    "elapsed_time_s",
    "d1_raw_cm",
    "d2_raw_cm",
    "d3_raw_cm",
    "d1_smooth_cm",
    "d2_smooth_cm",
    "d3_smooth_cm",
    "x_cm",
    "y_cm",
    "x_smooth_cm",
    "y_smooth_cm",
    "error_rms_cm",
    "status",
    "raw_text",
])


# ==================================================
# シリアル接続
# ==================================================

ser = serial.Serial(
    PORT,
    BAUDRATE,
    timeout=0.05
)

time.sleep(2)

print("===== Serial Connected =====")
print(f"PORT: {PORT}")
print(f"BAUDRATE: {BAUDRATE}")
print()

print("===== Sensor Layout =====")
for name, pos in SENSOR_POSITIONS.items():
    print(f"{name}: {pos}")
print()

print("===== Search Area =====")
print(f"X: {SEARCH_X_MIN} to {SEARCH_X_MAX} cm")
print(f"Y: {SEARCH_Y_MIN} to {SEARCH_Y_MAX} cm")
print(f"Grid step: {GRID_STEP_CM} cm")
print()

print("===== Sensor Direction =====")
print("D1: toward around (25, 35)")
print("D2: toward around (25, 35)")
print("D3: toward around (25, 35)")
print()


# ==================================================
# 受信データ解析
# ==================================================

def parse_distance_line(line_text):
    """
    ESP32からの1行を解析する。

    期待形式:
      D1:23.45,D2:31.20,D3:28.76
    """

    pattern = (
        r"D1:\s*(nan|[-+]?[0-9]*\.?[0-9]+)"
        r"\s*,\s*D2:\s*(nan|[-+]?[0-9]*\.?[0-9]+)"
        r"\s*,\s*D3:\s*(nan|[-+]?[0-9]*\.?[0-9]+)"
    )

    match = re.search(
        pattern,
        line_text,
        re.IGNORECASE
    )

    if not match:
        return None

    values = {}

    for i, name in enumerate(sensor_names):
        text_value = match.group(i + 1)

        if text_value.lower() == "nan":
            values[name] = np.nan
        else:
            values[name] = float(text_value)

    return values


# ==================================================
# 距離の有効性チェック
# ==================================================

def is_valid_distance(value):
    if np.isnan(value):
        return False

    if value < MIN_DISTANCE_CM:
        return False

    if value > MAX_DISTANCE_CM:
        return False

    return True


# ==================================================
# 距離の平滑化
# ==================================================

def smooth_distances(raw_distances):
    smooth = {}

    for name in sensor_names:
        value = raw_distances[name]

        if is_valid_distance(value):
            distance_buffers[name].append(value)

        if len(distance_buffers[name]) > 0:
            smooth[name] = float(
                np.mean(distance_buffers[name])
            )
        else:
            smooth[name] = np.nan

    return smooth


# ==================================================
# 2D位置推定:グリッド探索
# ==================================================

def estimate_position_grid(distances):
    """
    3つの距離から、2D座標を推定する。
    """

    measured = np.array([
        distances["D1"],
        distances["D2"],
        distances["D3"],
    ], dtype=float)

    valid_mask = ~np.isnan(measured)

    # 有効な距離が2つ未満なら位置推定不可
    if np.sum(valid_mask) < 2:
        return np.nan, np.nan, np.nan

    # 候補点ごとの差分
    diff = candidate_distances[:, valid_mask] - measured[valid_mask]

    # RMS誤差
    error_rms = np.sqrt(
        np.mean(diff ** 2, axis=1)
    )

    best_index = int(
        np.argmin(error_rms)
    )

    best_x = float(
        candidate_points[best_index, 0]
    )

    best_y = float(
        candidate_points[best_index, 1]
    )

    best_error = float(
        error_rms[best_index]
    )

    return best_x, best_y, best_error


# ==================================================
# 位置の平滑化
# ==================================================

def smooth_position(x, y):
    if np.isnan(x) or np.isnan(y):
        return np.nan, np.nan

    position_x_buffer.append(x)
    position_y_buffer.append(y)

    x_smooth = float(
        np.mean(position_x_buffer)
    )

    y_smooth = float(
        np.mean(position_y_buffer)
    )

    return x_smooth, y_smooth


# ==================================================
# ステータス判定
# ==================================================

def judge_status(error_rms):
    if np.isnan(error_rms):
        return "NO DATA"

    if error_rms <= GOOD_ERROR_CM:
        return "GOOD"

    if error_rms <= CHECK_ERROR_CM:
        return "CHECK"

    return "UNCERTAIN"


# ==================================================
# ステータスに応じた色設定
# ==================================================

def get_target_color(status):
    """
    推定精度に応じてターゲット色を変える。

    GOOD      : 明るい緑
    CHECK     : 明るい黄色
    UNCERTAIN : 明るい赤
    NO DATA   : 明るい灰色
    """

    if status == "GOOD":
        return "lime"

    if status == "CHECK":
        return "gold"

    if status == "UNCERTAIN":
        return "tomato"

    return "lightgray"


# ==================================================
# シリアルデータ読み取り
# ==================================================

def read_serial_data():
    global latest_raw_text
    global latest_distances_raw
    global latest_distances_smooth
    global latest_position

    updated = False

    while ser.in_waiting > 0:
        line_text = (
            ser.readline()
            .decode("utf-8", errors="ignore")
            .strip()
        )

        if not line_text:
            continue

        parsed = parse_distance_line(
            line_text
        )

        if parsed is None:
            continue

        latest_raw_text = line_text
        latest_distances_raw = parsed

        latest_distances_smooth = smooth_distances(
            latest_distances_raw
        )

        x, y, error_rms = estimate_position_grid(
            latest_distances_smooth
        )

        x_smooth, y_smooth = smooth_position(
            x,
            y
        )

        status = judge_status(
            error_rms
        )

        latest_position = {
            "x": x,
            "y": y,
            "x_smooth": x_smooth,
            "y_smooth": y_smooth,
            "error_rms": error_rms,
            "status": status,
        }

        elapsed_time = time.time() - start_time

        csv_writer.writerow([
            f"{elapsed_time:.3f}",
            f"{latest_distances_raw['D1']:.2f}" if not np.isnan(latest_distances_raw["D1"]) else "",
            f"{latest_distances_raw['D2']:.2f}" if not np.isnan(latest_distances_raw["D2"]) else "",
            f"{latest_distances_raw['D3']:.2f}" if not np.isnan(latest_distances_raw["D3"]) else "",
            f"{latest_distances_smooth['D1']:.2f}" if not np.isnan(latest_distances_smooth["D1"]) else "",
            f"{latest_distances_smooth['D2']:.2f}" if not np.isnan(latest_distances_smooth["D2"]) else "",
            f"{latest_distances_smooth['D3']:.2f}" if not np.isnan(latest_distances_smooth["D3"]) else "",
            f"{x:.2f}" if not np.isnan(x) else "",
            f"{y:.2f}" if not np.isnan(y) else "",
            f"{x_smooth:.2f}" if not np.isnan(x_smooth) else "",
            f"{y_smooth:.2f}" if not np.isnan(y_smooth) else "",
            f"{error_rms:.2f}" if not np.isnan(error_rms) else "",
            status,
            latest_raw_text,
        ])

        csv_file.flush()

        print(
            f"D1={latest_distances_smooth['D1']:.1f}, "
            f"D2={latest_distances_smooth['D2']:.1f}, "
            f"D3={latest_distances_smooth['D3']:.1f} | "
            f"x={x_smooth:.1f}, y={y_smooth:.1f} | "
            f"err={error_rms:.2f} | {status}"
        )

        updated = True

    return updated


# ==================================================
# Matplotlib画面準備
# ==================================================

fig, ax = plt.subplots(
    figsize=(8, 7)
)

fig.suptitle(
    "3 Ultrasonic Sensors - 2D Position Estimation",
    fontsize=14
)

ax.set_aspect("equal", adjustable="box")
ax.set_xlim(X_MIN, X_MAX)
ax.set_ylim(Y_MIN, Y_MAX)
ax.set_xlabel("X [cm]")
ax.set_ylabel("Y [cm]")
ax.grid(True)

# センサー位置
sensor_scatter = ax.scatter(
    sensor_xy[:, 0],
    sensor_xy[:, 1],
    s=120,
    marker="^",
    label="Sensors"
)

for name, (sx, sy) in SENSOR_POSITIONS.items():
    ax.text(
        sx + 0.8,
        sy + 0.8,
        name,
        fontsize=11,
        fontweight="bold"
    )

# 探索エリア枠
search_area_x = [
    SEARCH_X_MIN,
    SEARCH_X_MAX,
    SEARCH_X_MAX,
    SEARCH_X_MIN,
    SEARCH_X_MIN,
]

search_area_y = [
    SEARCH_Y_MIN,
    SEARCH_Y_MIN,
    SEARCH_Y_MAX,
    SEARCH_Y_MAX,
    SEARCH_Y_MIN,
]

search_area_line, = ax.plot(
    search_area_x,
    search_area_y,
    linestyle="--",
    linewidth=1.5,
    label="Search area"
)

# 推定位置
target_point, = ax.plot(
    [],
    [],
    marker="o",
    markersize=16,
    linestyle="None",
    color="lightgray",
    markeredgecolor="black",
    markeredgewidth=1.5,
    label="Estimated target"
)

# 距離円
distance_circles = []

# 情報テキスト
info_text = ax.text(
    0.02,
    0.98,
    "",
    transform=ax.transAxes,
    va="top",
    fontsize=10,
    bbox=dict(
        boxstyle="round",
        facecolor="white",
        alpha=0.85
    )
)

# 凡例:右上
ax.legend(
    loc="upper right"
)


# ==================================================
# グラフ更新処理
# ==================================================

def update(frame):
    global distance_circles

    read_serial_data()

    # ----------------------------------------------
    # 距離円更新
    # ----------------------------------------------

    for circle in distance_circles:
        circle.remove()

    distance_circles = []

    if SHOW_DISTANCE_CIRCLES:
        for name in sensor_names:
            distance = latest_distances_smooth[name]

            if np.isnan(distance):
                continue

            sx, sy = SENSOR_POSITIONS[name]

            circle = Circle(
                (sx, sy),
                distance,
                fill=False,
                linestyle=":",
                linewidth=1.2,
                alpha=0.7
            )

            ax.add_patch(circle)
            distance_circles.append(circle)

    # ----------------------------------------------
    # 推定点更新
    # ----------------------------------------------

    x = latest_position["x_smooth"]
    y = latest_position["y_smooth"]
    status = latest_position["status"]

    target_color = get_target_color(status)

    target_point.set_color(target_color)
    target_point.set_markerfacecolor(target_color)
    target_point.set_markeredgecolor("black")
    target_point.set_markeredgewidth(1.5)

    if not np.isnan(x) and not np.isnan(y):
        target_point.set_data(
            [x],
            [y]
        )
    else:
        target_point.set_data(
            [],
            []
        )

    # ----------------------------------------------
    # 情報表示更新
    # ----------------------------------------------

    d1 = latest_distances_smooth["D1"]
    d2 = latest_distances_smooth["D2"]
    d3 = latest_distances_smooth["D3"]

    error_rms = latest_position["error_rms"]

    def fmt(value):
        if np.isnan(value):
            return "---"
        return f"{value:.1f}"

    info_text.set_text(
        f"D1: {fmt(d1)} cm\n"
        f"D2: {fmt(d2)} cm\n"
        f"D3: {fmt(d3)} cm\n"
        f"\n"
        f"X: {fmt(x)} cm\n"
        f"Y: {fmt(y)} cm\n"
        f"Error RMS: {fmt(error_rms)} cm\n"
        f"Status: {status}"
    )

    return []


# ==================================================
# 終了処理
# ==================================================

def on_close(event):
    print("終了処理を実行します。")

    try:
        csv_file.close()
    except Exception:
        pass

    try:
        ser.close()
    except Exception:
        pass

    print(f"CSVを保存しました: {OUTPUT_CSV_FILE}")


fig.canvas.mpl_connect(
    "close_event",
    on_close
)


# ==================================================
# アニメーション開始
# ==================================================

ani = FuncAnimation(
    fig,
    update,
    interval=UPDATE_INTERVAL_MS,
    cache_frame_data=False
)

plt.show()

コメント