
概要
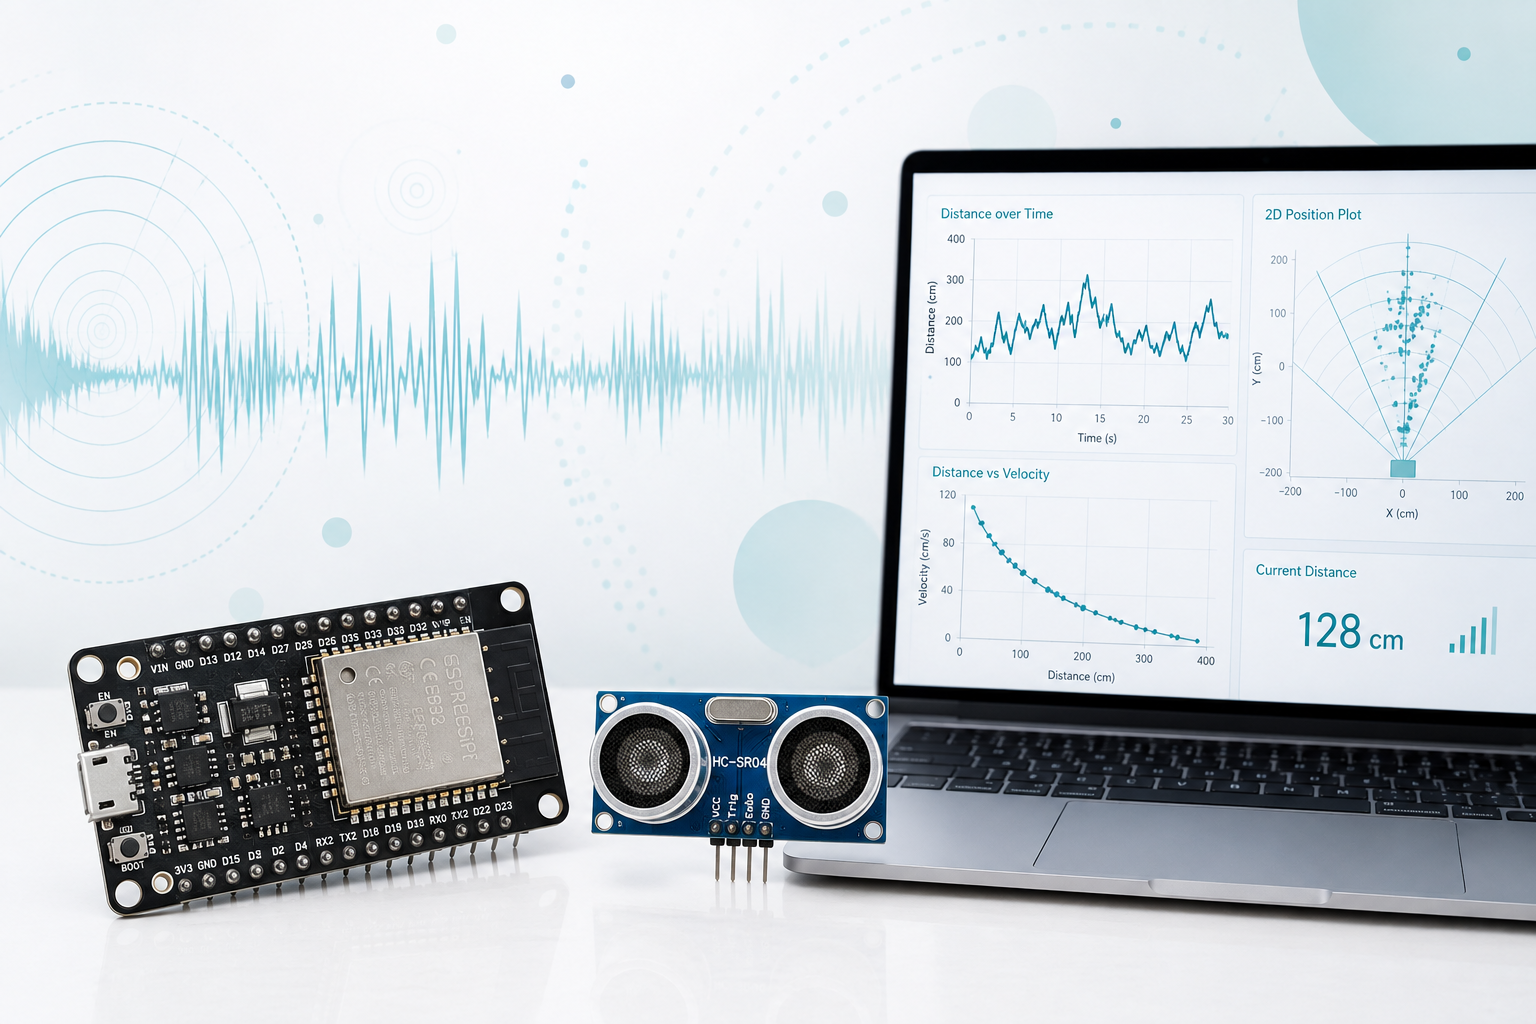
今回は、HC-SR04で取得した距離と速度のデータを使って、対象物の状態を機械学習で分類します。
前回は、人が決めたしきい値を使って、ルールベースで接近・停止・離反を判定しました。
第7回では、距離や速度の特徴量と正解ラベルを使い、Decision TreeやRandom Forestで状態を自動分類します。
人がルールを決めるのではなく、データから分類ルールを学習することで、どこまで状態判定できるかを確認します。
ちょっとしたデジタル化のトライアルをお考えの方に、少しでも参考になればうれしいです。
詳しくは、以下のYouTube動画をご覧ください。

プログラムコード
マイコン(ESP32)
- 超音波を発射
- 対象物で反射
- 戻ってくるまでの時間を測定
- 音速から距離を計算
#define TRIG_PIN 13
#define ECHO_PIN 14

// 最大測定距離[cm]
#define MAX_DISTANCE 700

// タイムアウト時間[μs]
float timeOut = MAX_DISTANCE * 60;

// 音速[m/s]
const int SOUND_VELOCITY = 340;

void setup()
{
    pinMode(TRIG_PIN, OUTPUT);
    pinMode(ECHO_PIN, INPUT);

    Serial.begin(115200);
}

void loop()
{
    float distance = getDistance();

    Serial.print("Distance: ");
    Serial.print(distance);
    Serial.println(" cm");

    delay(100);
}


/*************************************************
 * 距離測定関数
 *************************************************/
float getDistance()
{
    unsigned long pingTime;

    // 超音波パルス送信
    digitalWrite(TRIG_PIN, HIGH);
    delayMicroseconds(10);
    digitalWrite(TRIG_PIN, LOW);

    // 反射波の時間測定
    pingTime = pulseIn(
        ECHO_PIN,
        HIGH,
        timeOut
    );

    // 距離計算
    float distance =
        (float)pingTime *
        SOUND_VELOCITY /
        2 /
        10000;

    return distance;
}
Python(学習モデル作成用プログラム)
- 学習用CSVファイルを読み込み
- 距離・速度に関する特徴量と正解ラベルを取り出す
- 欠損値を除外し、学習用データと評価用データに分割
- Decision Treeで状態分類モデルを学習
- Decision Treeの分類精度、分類レポート、混同行列を出力
- Decision Treeの判定構造を画像として保存
- Random Forestで状態分類モデルを学習
- Random Forestの分類精度、分類レポート、混同行列を出力
- Random Forestの特徴量重要度をグラフ化
- 学習済みモデルをファイルに保存
- 評価データの一部を使って、簡単な予測テストを実施
from pathlib import Path

import pandas as pd
import numpy as np
import matplotlib.pyplot as plt
import joblib

from sklearn.model_selection import train_test_split
from sklearn.tree import DecisionTreeClassifier, plot_tree
from sklearn.ensemble import RandomForestClassifier
from sklearn.metrics import (
    accuracy_score,
    confusion_matrix,
    ConfusionMatrixDisplay,
    classification_report
)


# ============================================
# ▼ここだけ設定すればOK
# ============================================

# このファイル train_model.py は、
# parking_ml_project/scripts/train_model.py
# に置く想定です。
#
# BASE_DIR は scripts の1つ上のフォルダ、
# つまり parking_ml_project を指します。

BASE_DIR = Path(__file__).resolve().parent.parent

DATA_DIR = BASE_DIR / "data" / "features"
MODEL_DIR = BASE_DIR / "models"
RESULT_DIR = BASE_DIR / "results"

# 出力先フォルダがなければ自動作成
MODEL_DIR.mkdir(parents=True, exist_ok=True)
RESULT_DIR.mkdir(parents=True, exist_ok=True)

CSV_FILE = DATA_DIR / "parking_ml_training_features_all_ml_ready.csv"

TEST_SIZE = 0.25
RANDOM_STATE = 42

DECISION_TREE_MODEL_FILE = MODEL_DIR / "decision_tree_parking_model.pkl"
RANDOM_FOREST_MODEL_FILE = MODEL_DIR / "random_forest_parking_model.pkl"

FEATURE_IMPORTANCE_FILE = RESULT_DIR / "feature_importance_random_forest.png"
CONFUSION_MATRIX_DT_FILE = RESULT_DIR / "confusion_matrix_decision_tree.png"
CONFUSION_MATRIX_RF_FILE = RESULT_DIR / "confusion_matrix_random_forest.png"
DECISION_TREE_IMAGE_FILE = RESULT_DIR / "decision_tree_structure.png"


# ============================================
# パス確認
# ============================================

print("===== Path Check =====")
print("BASE_DIR:", BASE_DIR)
print("CSV_FILE:", CSV_FILE)
print("MODEL_DIR:", MODEL_DIR)
print("RESULT_DIR:", RESULT_DIR)
print()

if not CSV_FILE.exists():
    raise FileNotFoundError(
        f"学習用CSVが見つかりません。\n"
        f"以下の場所に配置してください。\n"
        f"{CSV_FILE}"
    )


# ============================================
# 学習データ読み込み
# ============================================

df = pd.read_csv(CSV_FILE)

print("===== Loaded Data =====")
print(df.head())
print()
print("Data shape:", df.shape)
print()


# ============================================
# 使用する特徴量とラベル
# ============================================

feature_columns = [
    "distance_mean",
    "distance_min",
    "distance_max",
    "distance_range",
    "distance_delta",
    "velocity_mean",
    "velocity_abs_mean",
    "velocity_std",
]

target_column = "label"


# ============================================
# 必要な列があるか確認
# ============================================

required_columns = feature_columns + [target_column]

missing_columns = [
    col for col in required_columns
    if col not in df.columns
]

if missing_columns:
    raise ValueError(
        "必要な列がCSVに存在しません。\n"
        f"不足している列: {missing_columns}"
    )


# ============================================
# 欠損値チェック
# ============================================

df = df.dropna(
    subset=feature_columns + [target_column]
).reset_index(drop=True)

X = df[feature_columns]
y = df[target_column]

print("===== Label Count =====")
print(y.value_counts())
print()


# ============================================
# 学習用・評価用データに分割
# ============================================

X_train, X_test, y_train, y_test = train_test_split(
    X,
    y,
    test_size=TEST_SIZE,
    random_state=RANDOM_STATE,
    stratify=y
)

print("===== Train / Test Split =====")
print("Train:", X_train.shape)
print("Test :", X_test.shape)
print()


# ============================================
# 1. Decision Treeで学習
# ============================================

dt_model = DecisionTreeClassifier(
    max_depth=4,
    random_state=RANDOM_STATE
)

dt_model.fit(
    X_train,
    y_train
)

y_pred_dt = dt_model.predict(
    X_test
)

dt_accuracy = accuracy_score(
    y_test,
    y_pred_dt
)

print("===== Decision Tree Result =====")
print("Accuracy:", dt_accuracy)
print()
print(classification_report(y_test, y_pred_dt))


# ============================================
# Decision Tree 混同行列
# ============================================

labels = sorted(y.unique())

cm_dt = confusion_matrix(
    y_test,
    y_pred_dt,
    labels=labels
)

disp_dt = ConfusionMatrixDisplay(
    confusion_matrix=cm_dt,
    display_labels=labels
)

fig, ax = plt.subplots(figsize=(7, 6))

disp_dt.plot(
    ax=ax,
    cmap="Blues",
    values_format="d"
)

ax.set_title("Confusion Matrix - Decision Tree")
plt.xticks(rotation=30)
plt.tight_layout()
plt.savefig(CONFUSION_MATRIX_DT_FILE, dpi=300)
plt.show()
plt.close(fig)


# ============================================
# Decision Tree 構造を表示
# ============================================

fig = plt.figure(figsize=(18, 10))

plot_tree(
    dt_model,
    feature_names=feature_columns,
    class_names=dt_model.classes_,
    filled=True,
    rounded=True,
    fontsize=9
)

plt.title("Decision Tree Structure")
plt.tight_layout()
plt.savefig(DECISION_TREE_IMAGE_FILE, dpi=300)
plt.show()
plt.close(fig)


# ============================================
# 2. Random Forestで学習
# ============================================

rf_model = RandomForestClassifier(
    n_estimators=100,
    max_depth=5,
    random_state=RANDOM_STATE
)

rf_model.fit(
    X_train,
    y_train
)

y_pred_rf = rf_model.predict(
    X_test
)

rf_accuracy = accuracy_score(
    y_test,
    y_pred_rf
)

print("===== Random Forest Result =====")
print("Accuracy:", rf_accuracy)
print()
print(classification_report(y_test, y_pred_rf))


# ============================================
# Random Forest 混同行列
# ============================================

cm_rf = confusion_matrix(
    y_test,
    y_pred_rf,
    labels=labels
)

disp_rf = ConfusionMatrixDisplay(
    confusion_matrix=cm_rf,
    display_labels=labels
)

fig, ax = plt.subplots(figsize=(7, 6))

disp_rf.plot(
    ax=ax,
    cmap="Greens",
    values_format="d"
)

ax.set_title("Confusion Matrix - Random Forest")
plt.xticks(rotation=30)
plt.tight_layout()
plt.savefig(CONFUSION_MATRIX_RF_FILE, dpi=300)
plt.show()
plt.close(fig)


# ============================================
# 特徴量重要度
# ============================================

importance = rf_model.feature_importances_

importance_df = pd.DataFrame({
    "feature": feature_columns,
    "importance": importance
}).sort_values(
    "importance",
    ascending=True
)

print("===== Feature Importance =====")
print(importance_df.sort_values("importance", ascending=False))
print()

fig = plt.figure(figsize=(8, 5))

plt.barh(
    importance_df["feature"],
    importance_df["importance"]
)

plt.title("Feature Importance - Random Forest")
plt.xlabel("Importance")
plt.ylabel("Feature")
plt.tight_layout()
plt.savefig(FEATURE_IMPORTANCE_FILE, dpi=300)
plt.show()
plt.close(fig)


# ============================================
# モデル保存
# ============================================

joblib.dump(
    dt_model,
    DECISION_TREE_MODEL_FILE
)

joblib.dump(
    rf_model,
    RANDOM_FOREST_MODEL_FILE
)

print("===== Model Saved =====")
print(f"Decision Tree : {DECISION_TREE_MODEL_FILE}")
print(f"Random Forest : {RANDOM_FOREST_MODEL_FILE}")
print()


# ============================================
# 簡単な予測テスト
# ============================================

sample = X_test.iloc[[0]]

print("===== Sample Prediction =====")
print("Input features:")
print(sample)
print()

print("True label:")
print(y_test.iloc[0])
print()

print("Decision Tree prediction:")
print(dt_model.predict(sample)[0])
print()

print("Random Forest prediction:")
print(rf_model.predict(sample)[0])
print()


# ============================================
# 出力ファイル一覧
# ============================================

print("===== Output Files =====")
print("Decision Tree model:")
print(DECISION_TREE_MODEL_FILE)
print()

print("Random Forest model:")
print(RANDOM_FOREST_MODEL_FILE)
print()

print("Decision Tree confusion matrix:")
print(CONFUSION_MATRIX_DT_FILE)
print()

print("Random Forest confusion matrix:")
print(CONFUSION_MATRIX_RF_FILE)
print()

print("Decision Tree structure:")
print(DECISION_TREE_IMAGE_FILE)
print()

print("Feature importance:")
print(FEATURE_IMPORTANCE_FILE)
Python(状態判定用プログラム)
- 学習済みのRandom Forestモデルを読み込み
- ESP32から距離データをリアルタイム受信
- 距離データを平滑化し、距離の変化から速度を計算
- 直近の一定時間の距離・速度データから特徴量を計算
- 特徴量を使って、Random Forestで状態を予測
- 予測確信度が低い場合は、
「UNCERTAIN」として表示 - 距離・速度・特徴量・予測結果・確信度をCSVに保存
- 距離マップ、速度マップ、距離推移、速度推移をリアルタイム表示
- 現在の機械学習判定結果と特徴量を画面下段に表示
from pathlib import Path
import serial
import time
import re
import csv
from collections import deque

import numpy as np
import pandas as pd
import matplotlib.pyplot as plt
from matplotlib.animation import FuncAnimation
import joblib


# ============================================
# ▼ここだけ設定すればOK
# ============================================

PORT = "COM5"
BAUDRATE = 115200

# 表示する時間幅 [s]
DISPLAY_SEC = 20.0

# カラーマップの時間分解能 [s]
TIME_BIN = 0.2

# 距離表示範囲 [cm]
DISTANCE_MIN = 0
DISTANCE_MAX = 30

# 速度表示範囲 [cm/s]
VELOCITY_MIN = -5
VELOCITY_MAX = 5

# 平滑化の窓幅
DISTANCE_SMOOTH_WINDOW = 5
VELOCITY_SMOOTH_WINDOW = 9

# 速度計算時に無視する最小時間差 [s]
MIN_DT = 0.01

# 特徴量を計算する時間幅 [s]
FEATURE_WINDOW_SEC = 1.0

# グラフ更新周期 [ms]
UPDATE_INTERVAL_MS = 100

# ============================================
# ▼機械学習判定の設定
# ============================================

# この値未満の確信度の場合は、判定結果を表示しない
CONFIDENCE_THRESHOLD = 0.30


# ============================================
# パス設定
# ============================================

# このファイルは
# 機械学習/scripts/realtime_predict.py
# に置く前提です。

BASE_DIR = Path(__file__).resolve().parent.parent

MODEL_DIR = BASE_DIR / "models"
LOG_DIR = BASE_DIR / "realtime_logs"

LOG_DIR.mkdir(parents=True, exist_ok=True)

MODEL_FILE = MODEL_DIR / "random_forest_parking_model.pkl"

EXPORT_CSV_FILE = LOG_DIR / "realtime_random_forest_prediction.csv"


# ============================================
# 使用する特徴量
# 学習時と順番を合わせること
# ============================================

FEATURE_COLUMNS = [
    "distance_mean",
    "distance_min",
    "distance_max",
    "distance_range",
    "distance_delta",
    "velocity_mean",
    "velocity_abs_mean",
    "velocity_std",
]


# ============================================
# 状態表示用
# ============================================

STATE_COLORS = {
    "EMPTY": "#91E0FF",
    "PARKING_IN": "#FEFF35",
    "OCCUPIED": "#FF5154",
    "PARKING_OUT": "#B2EC5D",
    "UNCERTAIN": "#d9d9d9",
    "UNKNOWN": "#d9d9d9",
}

STATE_LABELS = {
    "EMPTY": "EMPTY",
    "PARKING_IN": "PARKING IN",
    "OCCUPIED": "OCCUPIED",
    "PARKING_OUT": "PARKING OUT",
    "UNCERTAIN": "UNCERTAIN",
    "UNKNOWN": "UNKNOWN",
}


# ============================================
# モデル読み込み
# ============================================

if not MODEL_FILE.exists():
    raise FileNotFoundError(
        f"モデルファイルが見つかりません。\n"
        f"以下の場所に配置してください。\n"
        f"{MODEL_FILE}"
    )

model = joblib.load(MODEL_FILE)

print("===== Model Loaded =====")
print(MODEL_FILE)
print()


# ============================================
# シリアル接続
# ============================================

ser = serial.Serial(
    PORT,
    BAUDRATE,
    timeout=1
)

time.sleep(2)

print("===== Serial Connected =====")
print(f"PORT: {PORT}")
print(f"BAUDRATE: {BAUDRATE}")
print()


# ============================================
# CSV保存準備
# ============================================

csv_file = open(
    EXPORT_CSV_FILE,
    mode="w",
    newline="",
    encoding="utf-8-sig"
)

csv_writer = csv.writer(csv_file)

csv_writer.writerow([
    "elapsed_time_s",
    "raw_distance_cm",
    "distance_smooth_cm",
    "velocity_cm_s",
    "velocity_smooth_cm_s",
    "distance_mean",
    "distance_min",
    "distance_max",
    "distance_range",
    "distance_delta",
    "velocity_mean",
    "velocity_abs_mean",
    "velocity_std",
    "raw_predicted_state",
    "predicted_probability",
    "display_state",
    "confidence_threshold",
    "raw_text",
])


# ============================================
# データ保存用
# ============================================

time_data = deque()
distance_data = deque()
velocity_data = deque()

distance_buffer = deque(maxlen=DISTANCE_SMOOTH_WINDOW)
velocity_buffer = deque(maxlen=VELOCITY_SMOOTH_WINDOW)

last_time = None
last_distance_smooth = None

raw_predicted_state = "UNKNOWN"
display_state = "UNKNOWN"
current_probability = np.nan
current_features = {}

start_time = time.time()


# ============================================
# マップ作成関数
# ============================================

def make_time_map(time_values, value_values, t_start, t_end):
    time_bins = np.arange(
        t_start,
        t_end + TIME_BIN,
        TIME_BIN
    )

    if len(time_bins) < 2:
        time_bins = np.array([
            t_start,
            t_start + TIME_BIN
        ])

    n_time = len(time_bins) - 1

    value_map = np.full(
        (1, n_time),
        np.nan
    )

    time_array = np.array(time_values)
    value_array = np.array(value_values)

    for i in range(n_time):

        if i == n_time - 1:
            mask = (
                (time_array >= time_bins[i])
                &
                (time_array <= time_bins[i + 1])
            )
        else:
            mask = (
                (time_array >= time_bins[i])
                &
                (time_array < time_bins[i + 1])
            )

        if np.any(mask):
            value_map[0, i] = np.mean(
                value_array[mask]
            )

    return time_bins, value_map


# ============================================
# 特徴量計算
# ============================================

def calculate_features(time_array, distance_array, velocity_array, current_time):
    start_t = current_time - FEATURE_WINDOW_SEC

    mask = time_array >= start_t

    t_win = time_array[mask]
    d_win = distance_array[mask]
    v_win = velocity_array[mask]

    if len(t_win) < 2:
        return None

    distance_mean = float(np.mean(d_win))
    distance_min = float(np.min(d_win))
    distance_max = float(np.max(d_win))
    distance_range = float(distance_max - distance_min)
    distance_delta = float(d_win[-1] - d_win[0])

    velocity_mean = float(np.mean(v_win))
    velocity_abs_mean = float(np.mean(np.abs(v_win)))
    velocity_std = float(np.std(v_win))

    features = {
        "distance_mean": distance_mean,
        "distance_min": distance_min,
        "distance_max": distance_max,
        "distance_range": distance_range,
        "distance_delta": distance_delta,
        "velocity_mean": velocity_mean,
        "velocity_abs_mean": velocity_abs_mean,
        "velocity_std": velocity_std,
    }

    return features


# ============================================
# Random Forestで状態予測
# ============================================

def predict_state(features):
    if features is None:
        return "UNKNOWN", np.nan, "UNKNOWN"

    X = pd.DataFrame(
        [[features[col] for col in FEATURE_COLUMNS]],
        columns=FEATURE_COLUMNS
    )

    predicted_state = model.predict(X)[0]

    probability = np.nan

    if hasattr(model, "predict_proba"):
        proba = model.predict_proba(X)[0]
        probability = float(np.max(proba))

    # --------------------------------------------
    # 確信度が低い場合は、判定結果を表示しない
    # --------------------------------------------

    if np.isnan(probability):
        display_state = predicted_state

    elif probability < CONFIDENCE_THRESHOLD:
        display_state = "UNCERTAIN"

    else:
        display_state = predicted_state

    return predicted_state, probability, display_state


# ============================================
# 1画面レイアウト
# ============================================

fig = plt.figure(
    figsize=(16, 9)
)

fig.suptitle(
    "Ultrasonic Sensor Real-time ML Classification - Random Forest",
    fontsize=14
)

gs = fig.add_gridspec(
    3,
    4,
    width_ratios=[30, 1, 30, 1],
    height_ratios=[1, 3, 1.2],
    hspace=0.45,
    wspace=0.15
)

# 左上:距離マップ
ax_dist_map = fig.add_subplot(gs[0, 0])

# 左下:距離推移
ax_dist_trend = fig.add_subplot(
    gs[1, 0],
    sharex=ax_dist_map
)

# 距離カラーバー
cax_dist = fig.add_subplot(gs[0, 1])

# 右上:速度マップ
ax_vel_map = fig.add_subplot(gs[0, 2])

# 右下:速度推移
ax_vel_trend = fig.add_subplot(
    gs[1, 2],
    sharex=ax_vel_map
)

# 速度カラーバー
cax_vel = fig.add_subplot(gs[0, 3])

# 下段:状態表示
ax_state = fig.add_subplot(gs[2, :])


# ============================================
# 距離グラフ初期設定
# ============================================

dist_mesh = None

line_dist, = ax_dist_trend.plot(
    [],
    [],
    linewidth=2,
    label="Distance"
)

ax_dist_map.set_title("Distance Map")
ax_dist_map.set_yticks([])

ax_dist_trend.set_title("Distance Trend")
ax_dist_trend.set_xlabel("Time [s]")
ax_dist_trend.set_ylabel("Distance [cm]")
ax_dist_trend.set_ylim(DISTANCE_MIN, DISTANCE_MAX)
ax_dist_trend.grid(True)
ax_dist_trend.legend(loc="upper right")


# ============================================
# 速度グラフ初期設定
# ============================================

vel_mesh = None

line_vel, = ax_vel_trend.plot(
    [],
    [],
    linewidth=2,
    label="Velocity"
)

ax_vel_map.set_title("Velocity Map")
ax_vel_map.set_yticks([])

ax_vel_trend.axhline(
    0,
    linestyle="--",
    linewidth=1
)

ax_vel_trend.set_title("Velocity Trend")
ax_vel_trend.set_xlabel("Time [s]")
ax_vel_trend.set_ylabel("Velocity [cm/s]")
ax_vel_trend.set_ylim(VELOCITY_MIN, VELOCITY_MAX)
ax_vel_trend.grid(True)
ax_vel_trend.legend(loc="upper right")


# ============================================
# 状態表示 初期設定
# ============================================

ax_state.set_xticks([])
ax_state.set_yticks([])
ax_state.set_title("Current ML Prediction")

state_text = ax_state.text(
    0.02,
    0.65,
    "UNKNOWN",
    transform=ax_state.transAxes,
    fontsize=24,
    fontweight="bold",
    va="center"
)

feature_text = ax_state.text(
    0.02,
    0.25,
    "",
    transform=ax_state.transAxes,
    fontsize=11,
    va="center"
)

ax_state.set_facecolor(
    STATE_COLORS["UNKNOWN"]
)


# ============================================
# カラーバー初期化用ダミー
# ============================================

dummy_dist = ax_dist_map.pcolormesh(
    [0, TIME_BIN],
    [0, 1],
    np.array([[np.nan]]),
    cmap="turbo_r",
    vmin=DISTANCE_MIN,
    vmax=DISTANCE_MAX,
    shading="flat"
)

cbar_dist = fig.colorbar(
    dummy_dist,
    cax=cax_dist
)

cbar_dist.set_label("Distance [cm]")


dummy_vel = ax_vel_map.pcolormesh(
    [0, TIME_BIN],
    [0, 1],
    np.array([[np.nan]]),
    cmap="RdYlGn",
    vmin=VELOCITY_MIN,
    vmax=VELOCITY_MAX,
    shading="flat"
)

cbar_vel = fig.colorbar(
    dummy_vel,
    cax=cax_vel
)

cbar_vel.set_label("Velocity [cm/s]")


# ============================================
# 更新処理
# ============================================

def update(frame):
    global last_time
    global last_distance_smooth
    global dist_mesh
    global vel_mesh
    global raw_predicted_state
    global display_state
    global current_probability
    global current_features

    # --------------------------------
    # シリアルデータ受信
    # --------------------------------

    while ser.in_waiting > 0:

        line_text = (
            ser.readline()
            .decode("utf-8", errors="ignore")
            .strip()
        )

        # 例: Distance: 12.34cm
        match = re.search(
            r"Distance:\s*([0-9]+(?:\.[0-9]+)?)\s*cm",
            line_text
        )

        if not match:
            continue

        raw_distance = float(match.group(1))
        elapsed_time = time.time() - start_time

        # --------------------------------
        # 距離の平滑化
        # --------------------------------

        distance_buffer.append(raw_distance)

        distance_smooth = float(
            np.mean(distance_buffer)
        )

        # --------------------------------
        # 速度計算
        # --------------------------------

        if last_time is None:
            velocity = 0.0

        else:
            dt = elapsed_time - last_time

            if dt <= MIN_DT:
                velocity = 0.0
            else:
                velocity = (
                    distance_smooth
                    - last_distance_smooth
                ) / dt

        last_time = elapsed_time
        last_distance_smooth = distance_smooth

        # --------------------------------
        # 速度の平滑化
        # --------------------------------

        velocity_buffer.append(velocity)

        velocity_smooth = float(
            np.mean(velocity_buffer)
        )

        # --------------------------------
        # データ保存
        # --------------------------------

        time_data.append(elapsed_time)
        distance_data.append(distance_smooth)
        velocity_data.append(velocity_smooth)

        # --------------------------------
        # 特徴量計算と機械学習判定
        # --------------------------------

        time_array = np.array(time_data)
        distance_array = np.array(distance_data)
        velocity_array = np.array(velocity_data)

        current_features = calculate_features(
            time_array,
            distance_array,
            velocity_array,
            elapsed_time
        )

        raw_predicted_state, current_probability, display_state = predict_state(
            current_features
        )

        if current_features is None:
            write_features = {
                col: np.nan
                for col in FEATURE_COLUMNS
            }
        else:
            write_features = current_features

        csv_writer.writerow([
            f"{elapsed_time:.3f}",
            f"{raw_distance:.2f}",
            f"{distance_smooth:.2f}",
            f"{velocity:.2f}",
            f"{velocity_smooth:.2f}",
            f"{write_features['distance_mean']:.2f}",
            f"{write_features['distance_min']:.2f}",
            f"{write_features['distance_max']:.2f}",
            f"{write_features['distance_range']:.2f}",
            f"{write_features['distance_delta']:.2f}",
            f"{write_features['velocity_mean']:.2f}",
            f"{write_features['velocity_abs_mean']:.2f}",
            f"{write_features['velocity_std']:.2f}",
            raw_predicted_state,
            f"{current_probability:.3f}" if not np.isnan(current_probability) else "",
            display_state,
            f"{CONFIDENCE_THRESHOLD:.2f}",
            line_text
        ])

        csv_file.flush()

        if np.isnan(current_probability):
            print(
                f"{elapsed_time:.2f}s | "
                f"distance={distance_smooth:.2f}cm | "
                f"velocity={velocity_smooth:.2f}cm/s | "
                f"ML={display_state}"
            )
        else:
            print(
                f"{elapsed_time:.2f}s | "
                f"distance={distance_smooth:.2f}cm | "
                f"velocity={velocity_smooth:.2f}cm/s | "
                f"raw={raw_predicted_state} | "
                f"display={display_state} | "
                f"prob={current_probability:.2f}"
            )

    if len(time_data) < 2:
        return []

    # --------------------------------
    # 表示時間範囲
    # --------------------------------

    current_time = time_data[-1]
    t_start = max(0, current_time - DISPLAY_SEC)
    t_end = max(DISPLAY_SEC, current_time)

    time_array = np.array(time_data)
    distance_array = np.array(distance_data)
    velocity_array = np.array(velocity_data)

    mask = time_array >= t_start

    t_show = time_array[mask]
    d_show = distance_array[mask]
    v_show = velocity_array[mask]

    # ============================================
    # 距離マップ更新
    # ============================================

    time_bins, distance_map = make_time_map(
        t_show,
        d_show,
        t_start,
        t_end
    )

    if dist_mesh is not None:
        dist_mesh.remove()

    dist_mesh = ax_dist_map.pcolormesh(
        time_bins,
        [0, 1],
        distance_map,
        cmap="turbo_r",
        vmin=DISTANCE_MIN,
        vmax=DISTANCE_MAX,
        shading="flat"
    )

    ax_dist_map.set_xlim(t_start, t_end)
    ax_dist_map.set_yticks([])
    ax_dist_map.tick_params(labelbottom=False)

    line_dist.set_data(
        t_show,
        d_show
    )

    ax_dist_trend.set_xlim(t_start, t_end)
    ax_dist_trend.set_ylim(DISTANCE_MIN, DISTANCE_MAX)

    # ============================================
    # 速度マップ更新
    # ============================================

    time_bins, velocity_map = make_time_map(
        t_show,
        v_show,
        t_start,
        t_end
    )

    if vel_mesh is not None:
        vel_mesh.remove()

    vel_mesh = ax_vel_map.pcolormesh(
        time_bins,
        [0, 1],
        velocity_map,
        cmap="RdYlGn",
        vmin=VELOCITY_MIN,
        vmax=VELOCITY_MAX,
        shading="flat"
    )

    ax_vel_map.set_xlim(t_start, t_end)
    ax_vel_map.set_yticks([])
    ax_vel_map.tick_params(labelbottom=False)

    line_vel.set_data(
        t_show,
        v_show
    )

    ax_vel_trend.set_xlim(t_start, t_end)
    ax_vel_trend.set_ylim(VELOCITY_MIN, VELOCITY_MAX)

    # ============================================
    # 状態表示更新
    # ============================================

    label = STATE_LABELS.get(
        display_state,
        "UNKNOWN"
    )

    color = STATE_COLORS.get(
        display_state,
        STATE_COLORS["UNKNOWN"]
    )

    ax_state.set_facecolor(color)

    if np.isnan(current_probability):
        state_text.set_text(
            f"{label}"
        )
    else:
        if display_state == "UNCERTAIN":
            state_text.set_text(
                f"UNCERTAIN   confidence={current_probability:.2f} "
                f"< threshold={CONFIDENCE_THRESHOLD:.2f}"
            )
        else:
            state_text.set_text(
                f"{label}   confidence={current_probability:.2f}"
            )

    if current_features:
        feature_text.set_text(
            "Features  |  "
            f"distance_mean={current_features['distance_mean']:.1f} cm   "
            f"distance_delta={current_features['distance_delta']:.1f} cm   "
            f"velocity_mean={current_features['velocity_mean']:.2f} cm/s   "
            f"velocity_abs_mean={current_features['velocity_abs_mean']:.2f} cm/s   "
            f"velocity_std={current_features['velocity_std']:.2f} cm/s   "
            f"raw_prediction={raw_predicted_state}"
        )

    return []


# ============================================
# 終了処理
# ============================================

def on_close(event):
    print("終了処理を実行します。")

    try:
        csv_file.close()
    except Exception:
        pass

    try:
        ser.close()
    except Exception:
        pass

    print(f"CSVを保存しました: {EXPORT_CSV_FILE}")


fig.canvas.mpl_connect(
    "close_event",
    on_close
)


# ============================================
# アニメーション開始
# ============================================

ani = FuncAnimation(
    fig,
    update,
    interval=UPDATE_INTERVAL_MS,
    cache_frame_data=False
)

plt.show()
コメント