
概要
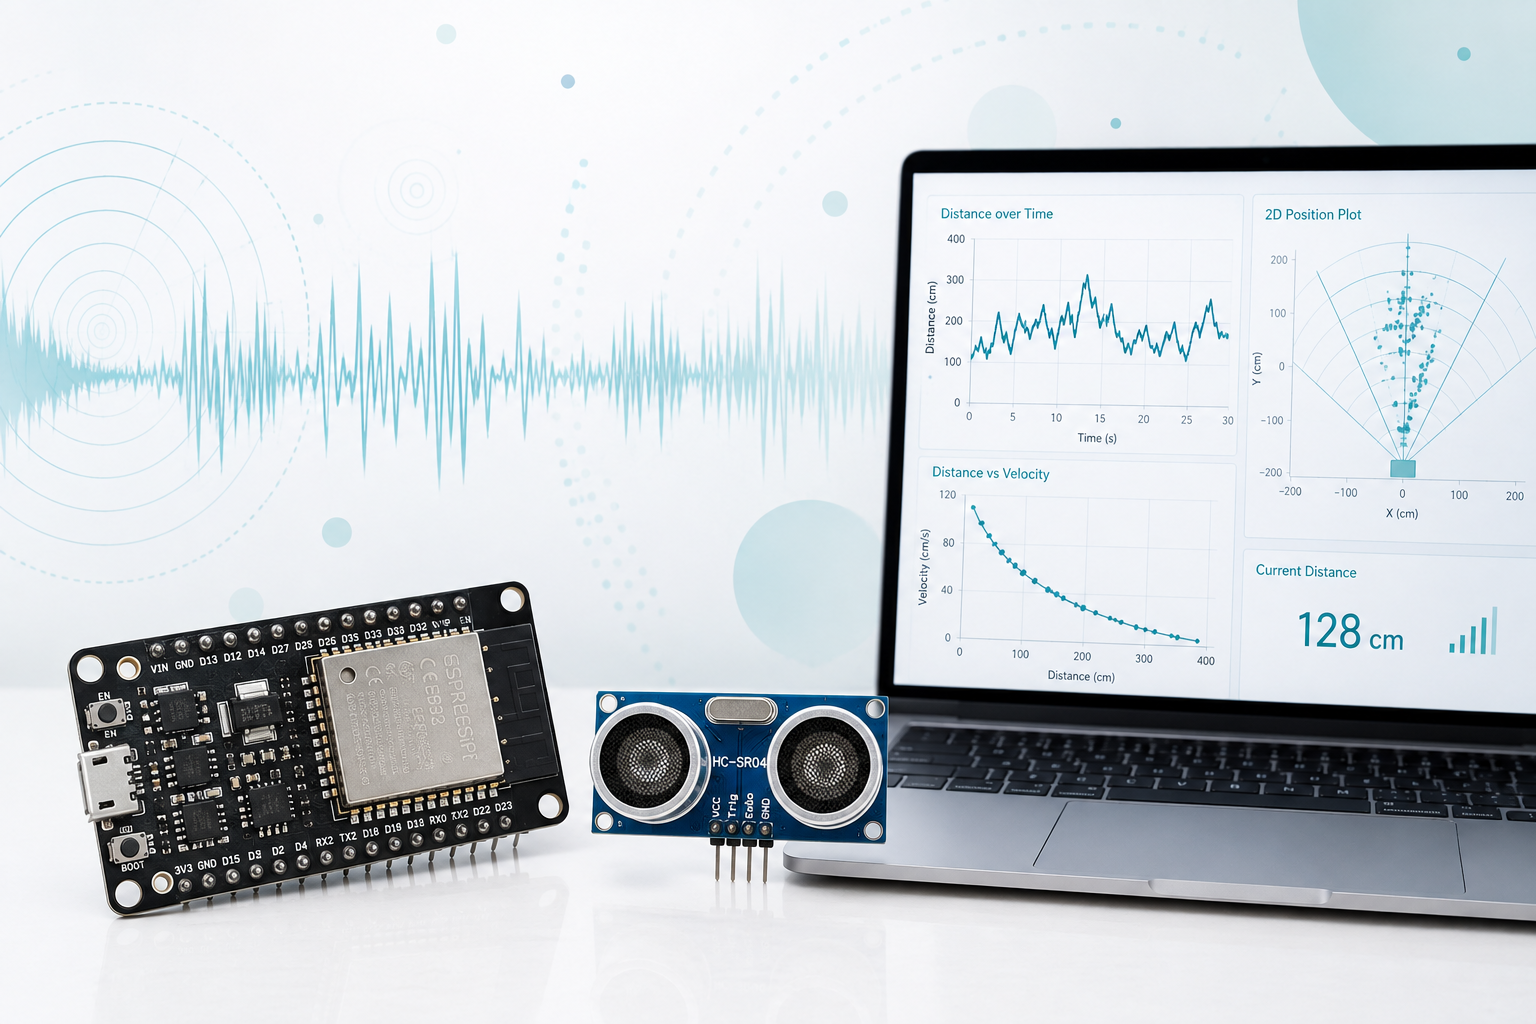
今回は、HC-SR04で測定した距離データから、対象物の速度を計算します。
距離データを使って、対象物が近づいているのか、止まっているのか、遠ざかっているのかをリアルタイムに判定します。
距離は「今どこにあるか」、速度は「どちらに動いているか」を表します。
今回は、距離と速度をリアルタイムグラフに表示し、接近・停止・離反の状態を判定します。
ちょっとしたデジタル化のトライアルをお考えの方に、少しでも参考になればうれしいです。
詳しくは、以下のYouTube動画をご覧ください。
プログラムコード
マイコン(ESP32)
- 超音波を発射
- 対象物で反射
- 戻ってくるまでの時間を測定
- 音速から距離を計算
#define TRIG_PIN 13
#define ECHO_PIN 14

// 最大測定距離[cm]
#define MAX_DISTANCE 700

// タイムアウト時間[μs]
float timeOut = MAX_DISTANCE * 60;

// 音速[m/s]
const int SOUND_VELOCITY = 340;

void setup()
{
    pinMode(TRIG_PIN, OUTPUT);
    pinMode(ECHO_PIN, INPUT);

    Serial.begin(115200);
}

void loop()
{
    float distance = getDistance();

    Serial.print("Distance: ");
    Serial.print(distance);
    Serial.println(" cm");

    delay(100);
}


/*************************************************
 * 距離測定関数
 *************************************************/
float getDistance()
{
    unsigned long pingTime;

    // 超音波パルス送信
    digitalWrite(TRIG_PIN, HIGH);
    delayMicroseconds(10);
    digitalWrite(TRIG_PIN, LOW);

    // 反射波の時間測定
    pingTime = pulseIn(
        ECHO_PIN,
        HIGH,
        timeOut
    );

    // 距離計算
    float distance =
        (float)pingTime *
        SOUND_VELOCITY /
        2 /
        10000;

    return distance;
}
Python(CSV読み込み版)
- CSVファイルから距離データを読み込み
- 時間と距離データを数値化し、欠損値や異常な時間差を除外
- 距離データを移動平均で平滑化
- 距離の変化量と時間差から速度を計算
- 速度データを移動平均で平滑化
- 速度の大きさと向きから、5段階の動きに分類
- 解析結果をCSVファイルに保存
- グラフ表示
import pandas as pd
import numpy as np
import matplotlib.pyplot as plt


# =========================================================
# ▼ ユーザー設定:ここだけ変更すればOK
# =========================================================

CSV_FILE = "ultrasonic_filter_export.csv"

# 速度計算に使う距離列
# raw_cm / outlier_removed_cm / moving_average_cm / median_cm
DISTANCE_COLUMN = "moving_average_cm"

EXPORT_CSV_FILE = "ultrasonic_motion_analysis.csv"

MIN_DT = 0.01

DISTANCE_SMOOTH_WINDOW = 5
VELOCITY_SMOOTH_WINDOW = 9

# 停止とみなす速度 [cm/s]
VELOCITY_DEAD_ZONE = 5.0

# 高速とみなす速度 [cm/s]
FAST_SPEED_THRESHOLD = 30.0


# =========================================================
# CSV読み込み
# =========================================================

df = pd.read_csv(CSV_FILE)

df["elapsed_time_s"] = pd.to_numeric(
    df["elapsed_time_s"],
    errors="coerce"
)

df[DISTANCE_COLUMN] = pd.to_numeric(
    df[DISTANCE_COLUMN],
    errors="coerce"
)

df = df.dropna(
    subset=["elapsed_time_s", DISTANCE_COLUMN]
).reset_index(drop=True)

df = df.sort_values("elapsed_time_s").reset_index(drop=True)


# =========================================================
# 時間重複・異常な時間差を除外
# =========================================================

dt_check = df["elapsed_time_s"].diff()

df = df[
    (dt_check.isna()) |
    (dt_check > MIN_DT)
].reset_index(drop=True)


# =========================================================
# 距離データ
# =========================================================

time_s = df["elapsed_time_s"].values
distance_cm = df[DISTANCE_COLUMN].values


# =========================================================
# 距離の平滑化
# =========================================================

distance_smooth = (
    pd.Series(distance_cm)
    .rolling(
        window=DISTANCE_SMOOTH_WINDOW,
        min_periods=1
    )
    .mean()
    .values
)


# =========================================================
# 速度計算
# 速度 = 距離変化量 ÷ 時間変化量
#
# 速度がマイナス:距離が小さくなる → 接近
# 速度がプラス:距離が大きくなる → 離反
# =========================================================

dt = np.diff(time_s)
dd = np.diff(distance_smooth)

velocity_cm_s = np.zeros(len(time_s))

valid = dt > MIN_DT
velocity_cm_s[1:][valid] = dd[valid] / dt[valid]


# =========================================================
# 速度の平滑化
# =========================================================

velocity_smooth = (
    pd.Series(velocity_cm_s)
    .rolling(
        window=VELOCITY_SMOOTH_WINDOW,
        min_periods=1
    )
    .mean()
    .values
)


# =========================================================
# 5段階判定
#
# -2 : 高速接近
# -1 : 低速接近
#  0 : 停止
#  1 : 低速離反
#  2 : 高速離反
# =========================================================

motion_state = []
motion_state_num = []

for v in velocity_smooth:

    if abs(v) < VELOCITY_DEAD_ZONE:
        motion_state.append("Stop")
        motion_state_num.append(0)

    elif v < 0 and abs(v) >= FAST_SPEED_THRESHOLD:
        motion_state.append("Fast approaching")
        motion_state_num.append(-2)

    elif v < 0:
        motion_state.append("Slow approaching")
        motion_state_num.append(-1)

    elif v > 0 and abs(v) >= FAST_SPEED_THRESHOLD:
        motion_state.append("Fast moving away")
        motion_state_num.append(2)

    else:
        motion_state.append("Slow moving away")
        motion_state_num.append(1)


# =========================================================
# 解析結果をCSV出力
# =========================================================

result_df = pd.DataFrame({
    "elapsed_time_s": time_s,
    "distance_cm": distance_cm,
    "distance_smooth_cm": distance_smooth,
    "velocity_cm_s": velocity_cm_s,
    "velocity_smooth_cm_s": velocity_smooth,
    "motion_state": motion_state,
    "motion_state_num": motion_state_num
})

result_df.to_csv(
    EXPORT_CSV_FILE,
    index=False,
    encoding="utf-8-sig"
)

print(f"解析結果を保存しました: {EXPORT_CSV_FILE}")


# =========================================================
# グラフ①:距離
# =========================================================

plt.figure(figsize=(12, 5))

plt.plot(time_s, distance_cm, label="Distance")
plt.plot(time_s, distance_smooth, label="Smoothed distance")

plt.title("Distance Time Series")
plt.xlabel("Time [s]")
plt.ylabel("Distance [cm]")
plt.grid(True)
plt.legend()

plt.show()


# =========================================================
# グラフ②:速度
# ゾーンを色分け
# =========================================================

plt.figure(figsize=(12, 5))

# 接近側:赤系
plt.axhspan(
    -max(abs(velocity_smooth)) - 10,
    -FAST_SPEED_THRESHOLD,
    alpha=0.15,
    color="red",
    label="Fast approaching zone"
)

plt.axhspan(
    -FAST_SPEED_THRESHOLD,
    -VELOCITY_DEAD_ZONE,
    alpha=0.08,
    color="red",
    label="Slow approaching zone"
)

# 停止ゾーン
plt.axhspan(
    -VELOCITY_DEAD_ZONE,
    VELOCITY_DEAD_ZONE,
    alpha=0.15,
    color="gray",
    label="Stop zone"
)

# 離反側:緑系
plt.axhspan(
    VELOCITY_DEAD_ZONE,
    FAST_SPEED_THRESHOLD,
    alpha=0.08,
    color="green",
    label="Slow moving away zone"
)

plt.axhspan(
    FAST_SPEED_THRESHOLD,
    max(abs(velocity_smooth)) + 10,
    alpha=0.15,
    color="green",
    label="Fast moving away zone"
)

plt.plot(
    time_s,
    velocity_smooth,
    linewidth=2,
    label="Smoothed velocity"
)

plt.axhline(0, linestyle="--")
plt.axhline(VELOCITY_DEAD_ZONE, linestyle=":")
plt.axhline(-VELOCITY_DEAD_ZONE, linestyle=":")
plt.axhline(FAST_SPEED_THRESHOLD, linestyle=":")
plt.axhline(-FAST_SPEED_THRESHOLD, linestyle=":")

plt.title("Velocity State Zones")
plt.xlabel("Time [s]")
plt.ylabel("Velocity [cm/s]")
plt.grid(True)
plt.legend(loc="upper right")

plt.show()


# =========================================================
# グラフ③:距離と速度
# =========================================================

fig, axes = plt.subplots(
    2,
    1,
    figsize=(12, 8),
    sharex=True
)

axes[0].plot(
    time_s,
    distance_smooth,
    label="Smoothed distance"
)

axes[0].set_title("Distance")
axes[0].set_ylabel("Distance [cm]")
axes[0].grid(True)
axes[0].legend()


# 速度ゾーン色分け
y_abs_max = max(abs(velocity_smooth)) + 10

axes[1].axhspan(
    -y_abs_max,
    -FAST_SPEED_THRESHOLD,
    alpha=0.15,
    color="red"
)

axes[1].axhspan(
    -FAST_SPEED_THRESHOLD,
    -VELOCITY_DEAD_ZONE,
    alpha=0.08,
    color="red"
)

axes[1].axhspan(
    -VELOCITY_DEAD_ZONE,
    VELOCITY_DEAD_ZONE,
    alpha=0.15,
    color="gray"
)

axes[1].axhspan(
    VELOCITY_DEAD_ZONE,
    FAST_SPEED_THRESHOLD,
    alpha=0.08,
    color="green"
)

axes[1].axhspan(
    FAST_SPEED_THRESHOLD,
    y_abs_max,
    alpha=0.15,
    color="green"
)

axes[1].plot(
    time_s,
    velocity_smooth,
    linewidth=2,
    label="Smoothed velocity"
)

axes[1].axhline(0, linestyle="--")
axes[1].axhline(VELOCITY_DEAD_ZONE, linestyle=":")
axes[1].axhline(-VELOCITY_DEAD_ZONE, linestyle=":")
axes[1].axhline(FAST_SPEED_THRESHOLD, linestyle=":")
axes[1].axhline(-FAST_SPEED_THRESHOLD, linestyle=":")

axes[1].set_title("Velocity")
axes[1].set_xlabel("Time [s]")
axes[1].set_ylabel("Velocity [cm/s]")
axes[1].grid(True)
axes[1].legend()

plt.tight_layout()
plt.show()


# =========================================================
# グラフ④:5段階判定結果
# =========================================================

plt.figure(figsize=(12, 4))

plt.step(
    time_s,
    motion_state_num,
    where="post",
    linewidth=2
)

# 背景色
plt.axhspan(-2.5, -1.5, alpha=0.15, color="red")
plt.axhspan(-1.5, -0.5, alpha=0.08, color="red")
plt.axhspan(-0.5, 0.5, alpha=0.15, color="gray")
plt.axhspan(0.5, 1.5, alpha=0.08, color="green")
plt.axhspan(1.5, 2.5, alpha=0.15, color="green")

plt.yticks(
    [-2, -1, 0, 1, 2],
    [
        "Fast approaching",
        "Slow approaching",
        "Stop",
        "Slow moving away",
        "Fast moving away"
    ]
)

plt.ylim(-2.5, 2.5)

plt.title("5-Level Motion State")
plt.xlabel("Time [s]")
plt.ylabel("State")
plt.grid(True)

plt.show()
Python(リアルタイム通信版)
- ESP32から距離データをリアルタイム受信
- 距離値を抽出し、移動平均で平滑化
- 平滑化した距離の変化から速度を計算
- 速度も移動平均で平滑化
- 速度から、接近・停止・離反を5段階で判定
- 距離と速度を上下2段のグラフでリアルタイム表示
import serial
import time
import re
import csv
from collections import deque

import numpy as np
import matplotlib.pyplot as plt
from matplotlib.animation import FuncAnimation


# =========================================================
# ▼ ユーザー設定:ここだけ変更すればOK
# =========================================================

PORT = "COM5"
BAUDRATE = 115200

EXPORT_CSV_FILE = "ultrasonic_motion_realtime.csv"

DISPLAY_POINTS = 100

MIN_DT = 0.01

DISTANCE_SMOOTH_WINDOW = 5
VELOCITY_SMOOTH_WINDOW = 9

VELOCITY_DEAD_ZONE = 5.0
FAST_SPEED_THRESHOLD = 30.0

UPDATE_INTERVAL_MS = 100

# 固定スケール
DISTANCE_Y_MIN = 0
DISTANCE_Y_MAX = 100

VELOCITY_Y_MIN = -50
VELOCITY_Y_MAX = 50


# =========================================================
# シリアル接続
# =========================================================

ser = serial.Serial(PORT, BAUDRATE, timeout=1)
time.sleep(2)


# =========================================================
# CSV保存準備
# =========================================================

csv_file = open(
    EXPORT_CSV_FILE,
    mode="w",
    newline="",
    encoding="utf-8-sig"
)

csv_writer = csv.writer(csv_file)

csv_writer.writerow([
    "elapsed_time_s",
    "raw_distance_cm",
    "distance_smooth_cm",
    "velocity_cm_s",
    "velocity_smooth_cm_s",
    "motion_state",
    "motion_state_num",
    "raw_text"
])


# =========================================================
# データ保存用
# =========================================================

time_plot = deque(maxlen=DISPLAY_POINTS)

raw_distance_plot = deque(maxlen=DISPLAY_POINTS)
distance_smooth_plot = deque(maxlen=DISPLAY_POINTS)

velocity_plot = deque(maxlen=DISPLAY_POINTS)
velocity_smooth_plot = deque(maxlen=DISPLAY_POINTS)

distance_buffer = deque(maxlen=DISTANCE_SMOOTH_WINDOW)
velocity_buffer = deque(maxlen=VELOCITY_SMOOTH_WINDOW)

last_time = None
last_distance_smooth = None

start_time = time.time()


# =========================================================
# 判定関数
# =========================================================

def judge_motion_state(v):
    if abs(v) < VELOCITY_DEAD_ZONE:
        return "Stop", 0
    elif v < 0 and abs(v) >= FAST_SPEED_THRESHOLD:
        return "Fast approaching", -2
    elif v < 0:
        return "Slow approaching", -1
    elif v > 0 and abs(v) >= FAST_SPEED_THRESHOLD:
        return "Fast moving away", 2
    else:
        return "Slow moving away", 1


# =========================================================
# 速度グラフ背景・基準線描画
# =========================================================

def draw_velocity_zones(ax):
    # 接近側:赤系
    ax.axhspan(
        VELOCITY_Y_MIN,
        -FAST_SPEED_THRESHOLD,
        alpha=0.15,
        color="red"
    )

    ax.axhspan(
        -FAST_SPEED_THRESHOLD,
        -VELOCITY_DEAD_ZONE,
        alpha=0.08,
        color="red"
    )

    # 停止ゾーン
    ax.axhspan(
        -VELOCITY_DEAD_ZONE,
        VELOCITY_DEAD_ZONE,
        alpha=0.15,
        color="gray"
    )

    # 離反側:緑系
    ax.axhspan(
        VELOCITY_DEAD_ZONE,
        FAST_SPEED_THRESHOLD,
        alpha=0.08,
        color="green"
    )

    ax.axhspan(
        FAST_SPEED_THRESHOLD,
        VELOCITY_Y_MAX,
        alpha=0.15,
        color="green"
    )

    # 基準線
    ax.axhline(0, linestyle="--")
    ax.axhline(VELOCITY_DEAD_ZONE, linestyle=":")
    ax.axhline(-VELOCITY_DEAD_ZONE, linestyle=":")
    ax.axhline(FAST_SPEED_THRESHOLD, linestyle=":")
    ax.axhline(-FAST_SPEED_THRESHOLD, linestyle=":")


# =========================================================
# グラフ準備
# =========================================================

fig, axes = plt.subplots(
    2,
    1,
    figsize=(12, 8),
    sharex=True
)

# 上段:距離
line_distance, = axes[0].plot(
    [],
    [],
    linewidth=2,
    label="Smoothed distance"
)

axes[0].set_title("Distance")
axes[0].set_ylabel("Distance [cm]")
axes[0].set_ylim(DISTANCE_Y_MIN, DISTANCE_Y_MAX)
axes[0].grid(True)
axes[0].legend(loc="upper right")


# 下段:速度
line_velocity, = axes[1].plot(
    [],
    [],
    linewidth=2,
    label="Smoothed velocity"
)

draw_velocity_zones(axes[1])

axes[1].set_title("Velocity")
axes[1].set_xlabel("Time [s]")
axes[1].set_ylabel("Velocity [cm/s]")
axes[1].set_ylim(VELOCITY_Y_MIN, VELOCITY_Y_MAX)
axes[1].grid(True)
axes[1].legend(loc="upper right")


# =========================================================
# 更新処理
# =========================================================

def update(frame):
    global last_time
    global last_distance_smooth

    while ser.in_waiting > 0:

        line_text = (
            ser.readline()
            .decode("utf-8", errors="ignore")
            .strip()
        )

        # 例: Distance: 52.34cm
        match = re.search(
            r"Distance:\s*(\d+\.?\d*)cm",
            line_text
        )

        if not match:
            continue

        raw_distance = float(match.group(1))
        elapsed_time = time.time() - start_time

        # ---------------------------
        # 距離の平滑化
        # ---------------------------

        distance_buffer.append(raw_distance)

        distance_smooth = float(
            np.mean(distance_buffer)
        )

        # ---------------------------
        # 速度計算
        # ---------------------------

        if last_time is None:
            velocity = 0.0

        else:
            dt = elapsed_time - last_time

            if dt <= MIN_DT:
                velocity = 0.0
            else:
                dd = distance_smooth - last_distance_smooth
                velocity = dd / dt

        last_time = elapsed_time
        last_distance_smooth = distance_smooth

        # ---------------------------
        # 速度の平滑化
        # ---------------------------

        velocity_buffer.append(velocity)

        velocity_smooth = float(
            np.mean(velocity_buffer)
        )

        # ---------------------------
        # 5段階判定
        # ---------------------------

        motion_state, motion_state_num = judge_motion_state(
            velocity_smooth
        )

        # ---------------------------
        # 表示用データに追加
        # ---------------------------

        time_plot.append(elapsed_time)

        raw_distance_plot.append(raw_distance)
        distance_smooth_plot.append(distance_smooth)

        velocity_plot.append(velocity)
        velocity_smooth_plot.append(velocity_smooth)

        # ---------------------------
        # CSV保存
        # ---------------------------

        csv_writer.writerow([
            f"{elapsed_time:.3f}",
            f"{raw_distance:.2f}",
            f"{distance_smooth:.2f}",
            f"{velocity:.2f}",
            f"{velocity_smooth:.2f}",
            motion_state,
            motion_state_num,
            line_text
        ])

        csv_file.flush()

        print(
            f"{elapsed_time:.2f}s | "
            f"distance={distance_smooth:.2f}cm | "
            f"velocity={velocity_smooth:.2f}cm/s | "
            f"{motion_state}"
        )

    # ---------------------------
    # グラフ更新
    # ---------------------------

    if len(time_plot) > 0:

        line_distance.set_data(
            time_plot,
            distance_smooth_plot
        )

        line_velocity.set_data(
            time_plot,
            velocity_smooth_plot
        )

        axes[0].set_xlim(
            max(0, time_plot[0]),
            time_plot[-1] + 1
        )

        # 縦軸は固定
        axes[0].set_ylim(
            DISTANCE_Y_MIN,
            DISTANCE_Y_MAX
        )

        axes[1].set_ylim(
            VELOCITY_Y_MIN,
            VELOCITY_Y_MAX
        )

    return line_distance, line_velocity


# =========================================================
# 終了処理
# =========================================================

def on_close(event):
    print("終了処理を実行します。")

    csv_file.close()
    ser.close()

    print(f"CSVを保存しました: {EXPORT_CSV_FILE}")


fig.canvas.mpl_connect(
    "close_event",
    on_close
)


# =========================================================
# アニメーション開始
# =========================================================

ani = FuncAnimation(
    fig,
    update,
    interval=UPDATE_INTERVAL_MS,
    cache_frame_data=False
)

plt.tight_layout()
plt.show()
コメント